A Look Back at 2022 and Ahead to 2023

Where There is Chaos, There is Often Opportunity By Rick Sharga As we prepare to exit one of the most tumultuous years for the housing market in recent memory, there’s a lot to unpack. The market started the year off white hot, with consumers, and individual and institutional investors competing for limited inventory, driving home prices up another 15% from 2020’s already-high numbers. Housing starts were increasing to levels not seen in a decade, and vacancy rates in owner-occupied and rental properties dropped below 1%. But the market’s momentum screeched to a stop as mortgage rates jumped from sub-4% to over 7% seemingly overnight, and prospective buyers faced the prospect of monthly mortgage payments that were 40%, 50% or 60% more than they’d been just a few months earlier. Sales fell immediately, along with builder and consumer sentiment. Weakening demand, worsening affordability, and higher financing costs don’t paint a rosy picture for real estate investors. What’s in store for the coming year? Will the U.S. economy enter a recession in 2023? Probably. The economy has been resilient over the past few years, especially considering the short-term turmoil caused by the COVID-19 pandemic and subsequent government shutdown. Most economic indicators today remain positive — job growth is surging, unemployment very low, productivity high, and consumer spending is strong. Normally, none of this would point towards a recession. But inflation has been running at its highest rates in 40 years, and the Federal Reserve has taken unprecedentedly aggressive action to get it under control, raising the Fed Funds rate more dramatically and more quickly than at any time in the past 20 years. Historically, when the Fed has taken this kind of action, a recession has usually followed. Dating back to 1955, the Fed has raised rates 11 times in order to get inflationary cycles under control. In three cases, the Fed was able to manage a “soft landing” for the economy and avoid a recession. In the other eight cases, it waited too long — inflation had either risen too far or become too persistent – and the Fed had to over-correct in order to slow the economy down. In all eight of those cases, a recession followed, and it seems highly likely that the Fed is driving us in that direction again, given how long it waited to begin addressing inflation, and how difficult it’s been to make any progress. Another historical trend that suggests a recession is heading our way is the Yield Curve Inversion. This phenomenon, an indication that the bond market is anticipating a recession, happens when yields on short term and long-term bonds invert — yields on long term bonds like 10-year U.S. Treasuries become lower than yields on short term bonds like 2-year U.S. Treasuries. The market has been in this inverted position for months now, and the degree of the inversion has been significant. Equally significant is that each of the last seven times there’s been a yield curve inversion, a recession has followed. There’s little reason to believe that we’ll escape making it eight times in a row. Most economists and market analysts believe that while a recession is likely, it’s also likely that it will be relatively mild and short-duration, since the underlying economic factors mentioned above are all strong, and household balance sheets are in good shape, with $4.6 trillion in savings accounts across the country. Will the housing market crash? Probably not. This depends, at least in part, on the definition of “housing crash.” With mortgage rates doubling this year — something that Freddie Mac says has never happened before — affordability became a huge problem for many prospective homebuyers, and home sales have declined significantly. According to Lawrence Yun, the Chief Economist for the National Association of Realtors (NAR), existing home sales in 2022 will fall 15% from 2021 and drop another 7% in 2023. In its October Housing Forecast, Fannie Mae projected a drop of 17.9% this year and 21.8% next year for existing homes and 19.6% and 12.6% for new home sales. Sales volume has definitely “crashed,” but prices haven’t followed suit. Unlike the 2008 market meltdown that led to a 24.7% decline in national home prices according to the Case Shiller Home Price Index, prices have continued to increase on a year-over-year basis, even as the number of homes sold has dropped. According to NAR, as of October, home prices have risen on an annual basis for a record 126 consecutive months. The rate of home price appreciation has slowed down considerably; according to Freddie Mac, national home prices rose by 2% in September, down from 14% increases just a few months prior. More recently, there’s been downward pressure on pricing — according to a report by ATTOM, the median sales price of homes dropped 3% nationally between the second and third quarters, marking the first quarterly decline in years. But there’s little indication of an impending crash in home prices. Supply remains low at about three months – half of what represents a healthy, balanced housing market — and demographically-driven demand remains, as the largest cohort of young adults in U.S. history marches towards the prime age for household formation and home ownership. There’s still more demand for the few homes that come to market, and the odds are that inventory will remain low in 2023. Homeowners with sub-4% mortgage rates are unlikely to rush to purchase a new home with a 7% mortgage and will probably sit tight and wait for market conditions to improve before listing their homes. Builders have reversed course since home sales began falling off, with housing starts declining by double digits each of the last three months. Homeowner equity, a record $29 trillion, gives current homeowners an enormous cushion against home price declines, and a hedge against losing their homes to foreclosure in the event their household finances take a turn for the worst. According to ATTOM, almost half of all homeowners with an active mortgage are “equity-rich,”

Read More

bluehammer

The Right Tool for the Job By Carole VanSickle Ellis If you only have one tool in your toolbox, it had better be a hammer. There are more than 100 tools and tasks that do not include pounding nails for which a carpenter or builder can use a hammer, and even the biggest fan of today’s modern pneumatic nailers probably still carries a hammer on the job. “A hammer is the one tool you had better have in your toolbox,” explained Robert Syverson, president and CEO of national real-time repair-estimating and valuation platform bluehammer™ (yes, all small letters). “Like a hammer, bluehammer is the one tool you absolutely need for efficient, accurate valuation and repair estimates. We have tightened and refined repair estimate accuracy and placed that accuracy within reach for anyone that uses this tool.” Bluehammer is not just a modern algorithm spitting out valuations, either. Its estimates are based on a vast array of modern and historic data, including 58 years of data concerning what should be involved in a project in the company’s proprietary database, real-time information, based on ZIP-code, on materials and labor costs, and an algorithm and software system that enables the program to spit out accurate values for any project within about 30 seconds. “Our data is all organic and built in-house,” said Issam Naber, vice president of operations at the company. Naber has worked with bluehammer for 18 years and describes his role as “making the data dance.” He explained, “Whatever the customer needs, I take our data and their requested inputs, throw my touch of magic on it to come up with a working model, and then pass it off to the developers to code.” A bluehammer user provides property-specific information not just about the location of the property, but also characteristics like bedrooms, bathrooms, living areas, and types of flooring. “With that information, we can make calculations behind the scenes for types of rooms to be included in the valuation by providing measurements, baseboards, number of outlets, HVAC vents, switches, doors, types of windows, etc,” said Naber. “We can get very granular, even factoring in wall thickness.” Then, the client gets a working model for estimating repairs at lightning speed. “We can do a 300-line-item estimate within 30 to 60 seconds,” he said proudly. “It’s pretty amazing.” Syverson noted that although bluehammer clients use the tool to get current valuations on properties they are considering buying or selling, the company also has a solid base of other real estate professionals using the tool as well. “Real estate agents are using it to get an idea of what a property might sell for and what types of improvements a client might make in order to boost that value,” he said. The tool also helps agents come into a property and revise an owner’s ideas about what that property should list or sell for. For example, an agent can input data to indicate closer values to room size, presence of large amenities (like an outdoor kitchen) or small ones (like a medicine cabinet in the bathroom), and immediately get a revised estimate that is adjusted every place that change will affect the value of the house. Then, the agent and client can work together to determine what improvements to make or if they will sell the house as it currently is. “You can adjust any quantity or quality of any item in the estimate,” said Syverson. “When you are done, you have a takeoff sheet right there that you can give to your contractor and start the work.” Ongoing Research and Data at Length and in Depth Naturally, a tool like bluehammer only works effectively if the data backing it is exhaustive. Clint Lien, the company’s vice president of cost research and business development, is intimately familiar with the data involved in making improvements and repairs to a property. After getting his contractor’s license at 19 and spending most of his life in the construction industry, Lien joined Bluebook in 2000 after consulting with them for a year prior. “I have worked many different trades and with multiple types of subcontractors, so I understand what truly goes into specialized and individualized tasks,” he said. “It is my job to make sure we take every screw and the turn of every screw into consideration when coming up with a valuation.” As an example, Lien took apart the “simple” process of replacing a one-square-foot section of drywall behind a door where a doorknob has knocked a hole in the wall. “This is a very common thing,” he said, “but there are multiple steps to the process that people overlook when they think about this process.” Lien broke down the process, including every action, item, and individual who might be involved: “First, you have to put plastic on the ground because you are going to make a mess when you cut the drywall and remove it. You are going to have to scoop that up and get rid of that. Then, you have to cut the drywall and place it, but you cannot just purchase one square foot of drywall. You will have to purchase three- or four-square feet, so you are going to have some waste. Then, you will use eight to 12 screws, which go into consideration when you are dealing with cost of materials. On top of that, you will have to factor in the time it takes to cut the drywall and put it in. Is that skilled or unskilled labor? There are hourly rates for both, and they are not the same. So, there is an additional factor of hourly time. “Once the drywall is in place, you will mud, tape, texture, and eventually paint. Every step must be evaluated in extreme detail right down to the razor blades in the utility knife used for cutting the drywall. Everything is considered, then combined to give the client a simple, easy-to-understand result.”  Lien noted that most line items in a project

Read More

How Data is Reshaping the Real Estate Industry

Data Provides Greater Insight and Potential for Success for Industry Professionals By Erica LaCentra Companies in the real estate industry today are in a unique position where there is truly greater access to data than ever before. Long gone are the days of making decisions based only on anecdotal evidence, historical trends, and experience within the industry. Having the ability to pull accurate data in real time is empowering those in the industry to get a clearer understanding of where opportunities exist and how to capitalize on those areas of opportunity. So how is data best being leveraged in real estate and how is it being utilized to reshape the industry as a whole? Improved Property Evaluations Whether you are an investor looking to purchase a property, an individual selling a property, an agent trying to list a property, a developer looking to build, or a lender looking to finance a property, having an accurate property valuation is critical to your success. Traditionally, industry professionals rely on their expertise or the expertise and experience of others to manually appraise a property. Utilization of comparative market analyses certainly has its place, however, think how helpful it would be to be able to incorporate other data points into this process to price a property. Being able to factor in additional information such as current and historical market trends, supply and demand levels in an area, fluctuating costs of materials for flippers and builders, and property features provide the ability to more accurately price a home whether it be today or looking into the future. In cases where comparable properties may be unavailable or in rare supply, think luxury properties or properties in rural areas, there can be a greater level of confidence in pricing a home utilizing these data points. Better Risk Mitigation Understanding and analyzing risk in the real estate industry is critical not only to buyers and investors but also to real estate lenders, property owners, and business owners. Having increased access to property data allows real estate professionals to make faster decisions with greater confidence to reduce potential losses. Data can help provide potential homebuyers with greater insight into the area a property is in, such as crime rate trends, projections of property values, and much more that will allow them to understand how their asset might appreciate over time, if at all. For investors, having better data can help them determine the best use of a property. Would a property be a better investment if renovated and sold quickly or is there greater potential for it as a rental property? Being able to analyze market supply and demand, market demographics, rent growth history and projections, home appreciation, and more can create a clear picture of how an investor can get the greatest return on their investment and feel secure in that decision. In the same token, having access to this data can give lenders a greater level of confidence in any of the transactions they are financing. Similarly, having data points about the future use and potential performance of a property can allow lenders to make more calculated decisions about the terms they are offering to ensure they are secure in their position on the transaction, as is their borrower. Utilizing data can help reduce rates of default and help mitigate potential risk because those items have been factored into the decision of whether to lend and what terms to lend at. Enhanced Marketing One of the biggest uses of data currently in the real estate industry is in marketing because professionals can develop a more targeted strategy. Agents and investors are now utilizing data to determine not only how to best market a property but to whom. Being able to identify buyer and renter demographics in various markets ensures that a property is being marketed to the right audience and the appropriate aspects of the property are being highlighted. Having the ability to properly target the right end-buyer or renter so that the property does not sit on the market too long is critical. Also, by looking at market trends and data analytics, real estate companies can start to better predict consumer behaviors, such as when somebody may be ready to buy or sell a property or move, and what areas of the market are going to have increased interest. This allows companies to get in front of potential customers at just the right time to capture those transactions rather than coming in too early or too late and fighting with the competition. Utilizing data allows companies to proactively market in the real estate industry rather than market reactively as the market shifts. Better Forecasting and Understanding of Market Trends The real estate market is cyclical in nature, but it can often be challenging to forecast and predict the future of the space simply by looking at historical data. Having access to data in real-time is a game-changer for not only predicting the future of the industry but also understanding why certain trends may be occurring and what that means for the industry down the line. Being able to overlay data points such as employment trends, inflation vs income levels, home price appreciation, and rent growth allows real estate professionals to get a more complete picture of the market and how it will be impacted by those factors. So even in times of potential turbulence, like the industry is experiencing right now, it is much easier to forecast what the future of the space looks like depending on both internal and external factors. This reduces panic and allows those in the space to adapt to market changes and better prepare rather than just being along for the ride. The Future of Real Estate Data is Now While utilizing data and analytics in real estate does not change the fundamentals of the space, it does provide greater insight and greater potential for success for industry professionals. The real estate market is not a murky crystal ball with

Read More

Using Location Insights to Uncover Untapped Markets

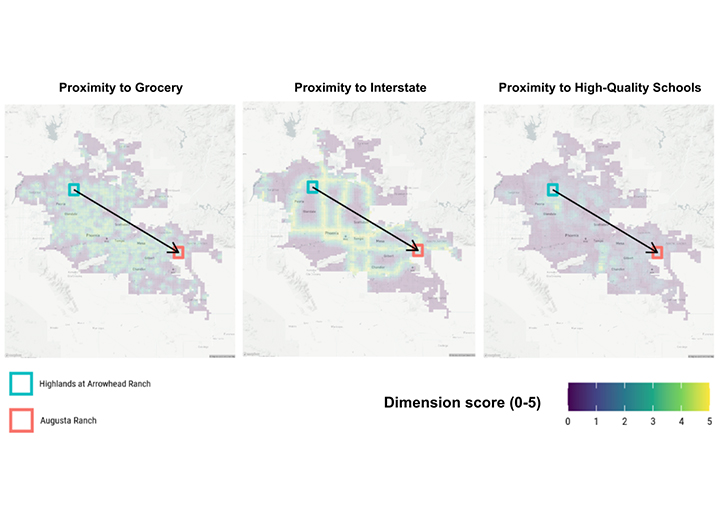
Understanding Granular Attributes Crucial in Identifying Opportunities and Risks By Jason Stanley Single-family rental (SFR) is hardly a new phenomenon, but it has seen explosive growth recently. Occupancy in Q4 2021 was near 95%. According to CoreLogic’s Single-Family Rent Index, SFR has seen 13 consecutive months of record-breaking year-over-year (YoY) rent growth for all price tiers. In April 2022, the YoY SFR rent price growth was more than double what it was one year prior and over six times higher than it was two years prior. The increasing competition for deals also creates new challenges, including how to discover opportunity-rich neighborhoods that investors are ignoring. Most investors already have access to the same information about new homes coming on the market. But what about hidden opportunities similar to high-demand neighborhoods that have not seen a spike in SFR investment? Most investors would jump at the opportunity to identify these gems, yet they lack the granular insights needed to do so. At Local Logic, we are building products that help investors quantify street- and neighborhood-level insights to identify these opportunities and avoid critical risks. Below, we show how investors can use our insights to discover promising neighborhoods that are not on most investors’ radars. Identifying a point of reference Phoenix is a top destination for residential real estate investment. In the Phoenix metro area, Arrowhead Ranch in Glendale stands out as one that has seen strong SFR activity. On the one hand, SFR homeseekers like the neighborhood. On the other hand, investors are sufficiently aware of the neighborhood’s attractiveness to make competition for deals a challenge. Where can we find neighborhoods similar to Arrowhead Ranch that also elicit strong demand from SFR homeseekers but with less competition? Quantifying neighborhoods on key SFR variables First, we need to select the variables we will use to measure similarity. Local Logic has hundreds of location insights at the site, street, and neighborhood levels, so there is a lot of room to analyze which variables best predict success. For this analysis, we chose variables that often show up in SFR buy boxes:  »         Proximity to grocery stores  »         Proximity to high-quality schools  »         Proximity to interchange  »         Neighborhood wellness score  »         Household income // Example: percent of households with annual income between $40,000 and $59,999; percent of households with annual income of $60,000 or above  »         Employment level // Example: percent of the civilian labor force 16 years of age or older that is employed  »         Percent change in the size of the labor force // Example: percent change in the numberof people 16 years of age or older in the civilian labor force  »         Median rent cost  »         Median mortgage cost Scoring each neighborhood in the Phoenix metro area on each of the listed dimensions produces a dataset for subsequent steps. With rows in the dataset as inputs, we use a k-nearest neighbor algorithm to measure neighborhood similarity. We could use this to identify the similarity between any pair of neighborhoods in the area. For this analysis, we focus on similarities with Arrowhead Ranch. Identifying a promising alternative neighborhood To identify the most promising alternative, we first rank neighborhoods by their similarity to Arrowhead Ranch. Augusta Ranch stands out as the most similar neighborhood. Augusta Ranch is 42 miles from Arrowhead Ranch. Yet, our granular location insights show that it is very similar on the dimensions selected as key for investment and for eliciting homeseeker demand. How individual neighborhoods score on a few key dimensions shows why Augusta Ranch ranks as most similar to Arrowhead Ranch. The figure above provides heat maps for proximity to grocery stores, interstate access points, and schools. For any of these dimensions, Arrowhead Ranch is similar to many neighborhoods in the metro area. When combining the dimensions listed above, Augusta Ranch stands out as very similar. Augusta Ranch is slightly further from downtown Phoenix than Arrowhead Ranch, yet it is close to several satellite towns that are commercial and employment centers. That bodes well for homeseekers seeing it as a residential neighborhood with easy access to employment hubs, retail centers, and services. Examining the number of SFR units currently on the market in the two neighborhoods suggests that Augusta Ranch has lower market activity. That is promising for investors looking for neighborhoods that are similar in character to our reference point but with less competition. Risk avoidance Risk analysis is something most investors do, but not all risks are treated as importantly as they should be. Physical climate risks were long ignored because the effects were not large enough to matter for most investments. That is no longer the case as physical risks grow in more locations. According to Climate-Check, Arizona ranks as the riskiest state in the country when it comes to drought. The Phoenix region faces lower drought risk than some other cities in the state. But even within a single metro region, it’s important to drill down since different neighborhoods face different levels of risk. Plotting ClimateCheck drought risk data for neighborhoods throughout Phoenix, we see that Arrowhead Ranch faces a higher drought risk than Augusta Ranch. This is another reason that makes Augusta Ranch a solid investment potential compared to other areas. Our location insights help investors understand granular attributes crucial in identifying and measuring opportunities and risks. This is true for SFR. But it’s just as true for multi-family, for-sale residential, office, retail, and public sector services. Customers are already using our granular insights to assess incoming deals, measure risk for new and existing properties, and uncover hidden opportunities. Every site has its own set of specific attributes, each of which can be measured and monitored — if you have access to the location insights to make that possible.

Read More

Smoke Alarm Best Practices

The Things That May Keep You From Waking In the Event of a Fire By Justin Ford Most of the world changed their clocks back this past month to adjust to daylight savings time. With that, came the biannual message of “Change Your Clocks, Change Your Batteries” from the local fire department, as a reminder that it is time to replace the batteries in your homes smoke alarm and carbon monoxide alarms. This message is outdated and no longer complete. The progression in what we know about smoke alarms and preventing fire deaths in homes has moved forward a long way since that message started coming out in the late 1980s. The 10-year-lithium-battery-powered smoke alarm was invented in 1995 and now more than half the alarms on the market include these types that do not need battery replacement. The National Fire Protection Association (NFPA) began requiring the replacement of smoke detectors after 10 years in 1999 because 30% of smoke alarms older than 10 years are estimated to not work due to aging, removal of batteries, or failure of the homeowner to replace dead batteries. The real message now, in addition to changing out batteries, should be, “Check your smoke alarm type and check your smoke alarm age. Change if older than 10 years. Change if not sufficient to detect all fire types.” (CO Alarms should be replaced after seven years). Back in the 1980s, when the message was to just change your batteries in your smoke and carbon monoxide alarms, you had about 17 minutes to escape a house fire. Today, with the prevalence of synthetic materials in the home, you have two to three minutes to get out. Types of Alarms What you may not know about smoke alarms is that there are two types. The first is the ionization smoke alarm which came out in the 1960s. Ionization smoke detectors are well equipped to sense the very small smoke particles produced by fast-moving, flaming fires such as in a kitchen. In the 1990s, photoelectric-type alarms started coming out and became more popular. Photoelectric smoke detectors are best at detecting large smoke particles from slow, smoldering fires, such as an electrical fire from a short-circuit in the wall. While most smoke alarms sold today are the photoelectric type, Consumer Reports ranked the Kidde and First Alert Dual-Detection alarms (which detects smoke and fire through both ionization and photoelectric means) as the top smoke alarms for people to have in their homes in 2022.  Alarm Placement is Even More Important To comply with NFPA standards, the smoke or CO alarms you install in your home must emit an alarm sound that is at least 85 decibels and not more than 110 decibels. Most smoke alarms and carbon monoxide alarms sold in the US and Canada are required to put out 85 dB of sound at 10 feet. The goal is that if you are sleeping in your bed in your home, and a smoke alarm is set off, anywhere in the home, you should hear it because, through interconnectivity (smoke alarms connected by wire or wirelessly) the smoke alarm in your bedroom will repeat the sound at 85 dB and you should awake and have time to escape.  As early as 1997, the US Consumer Product Safety Council (USPSC) said that “single station smoke alarms (a smoke alarm that is not interconnected to others) installed in two- or three-level homes may not be sufficient to alert occupants in all areas of the home or cause a delay for some individuals to respond immediately.”  To round out fire protection in your home, it is important to include heat detectors that can interconnect with your smoke alarms. If there is a fire in your attached garage or attic, you will want to know about it right away. Heat detectors look like smoke alarms but detect a fast rise in temperature, or temperatures that exceed 135 degrees Fahrenheit. Here are some other considerations: Alcohol and Smoke/CO Alarms A study published by Michelle Ball and Dorothy Bruck of the School of Psychology noted that “Under benign circumstances, unimpaired adults aged 18 to 64 respond well to smoke alarm signals of 85dB and are at a comparatively low risk for death. However, alcohol ingestion greatly increases fire fatality risk across all age groups. The study found that 65% of fire victims over the past decade that had working smoke alarms were under the influence of alcohol.” Elderly/Hearing Impaired and Smoke/CO Alarms The NFPA has highlighted that older adults are an “at risk group” when it comes to residential fires. The NFPA says, “the majority of fatal fires occur when people are sleeping, and because smoke can put you into a deeper sleep rather than waking you, it’s important to have a mechanical early warning of a fire to ensure that you wake up. If anyone in your household is deaf or if your own hearing is diminished, consider installing a smoke alarm that uses a flashing light or vibration to alert you to a fire emergency.” Children and Smoke/CO Alarms Children ages 2 to 12 typically don’t wake to the sound of a smoke alarm. According to the US Fire Administration, “Children sleep longer than adults and spend more time in slow-wave sleep, a sleep stage that requires the loudest noise to wake someone. This is especially problematic because data show that 31% of people killed in home fires are sleeping at the time of the fire.” Ring® and others make smoke alarm detectors that electronically recognize when smoke alarms are sounding and use inexpensive items such as the Dome® Siren to amplify the alarms. Accepting that the smoke alarm is the single most important item in the home is the first step in a journey to making sure your family and friends can escape in the unlikely event of a fire. Recognizing that it is not a matter of “if, but when” a fire may happen in your home, is the second

Read More

Managing an SFR Asset

Save Money Through a Preventative Approach By Vincent Deorio As so many know, the end goal of asset management is to maximize net operating income (NOI). There are three primary ways to achieve a high NOI — increase revenue, decrease vacancy, or decrease expenses. During the period of resident occupancy, above all else, increasing resident satisfaction through effective property management is the most valuable approach. This means not only being responsive to property maintenance requests, but also to any other resident inquiries. This focus on resident retention will always be a preeminent factor for asset management in a wide variety of housing typologies. According to John Burns, the average single-family rental (SFR) REIT has an annual turnover rate of 23%. This means the average resident stays for just under five years. This is a good indication of the “stickiness” of typical SFR residents. In 2018, the average turnover was 33% which is a three-year average tenancy. As residents stay longer, it is important to deliver a home with durable systems and sustainable materials and landscape design choices. And it is also important to perform ongoing asset management efforts even while existing residents are in place. One of the most important best-practices seen in the single-family rental market is that of the midyear checkup. These recurring six-month inspections allow property owners to have an improved peace of mind and allow property managers to stay ahead of maintenance challenges. Conducting a pre-inspection prior to move out is also a key step to reducing turn times. The Five Key Building Systems For Long-Term Success There are five major components that drive the success of any single-family rental: The roof, plumbing, electrical, structural, and HVAC systems. Within each category there are items which require preventative maintenance in order to best manage the asset. For example, gutters need to be cleaned regularly, especially in the Fall and Winter seasons. If not, water can back up and impact both the roof and structural systems. An HVAC system with R-22 refrigerant should be monitored carefully. R-22 is no longer produced, which will lead to high repair bills. As a result, it is wise to replace the entire system rather than spend $1,000+ on a temporary repair.  Water intrusion is the single biggest risk which can quickly deteriorate a home. Water can enter via plumbing challenges, structural problems, and certainly via faulty roofing systems. One such example is that of negative grading near a home, which can cause leaking into the basement. If not addressed, water intrusion could cause major damage to the foundation of the home along with ruining the interior finishes. Damage from this scenario could easily reach the tens of thousands of dollars. The Atlas Real Estate team found this recently at a brand-new rental home where the soil was not properly compacted at landscaping, causing a miniature sinkhole. The foundational implications could have been catastrophic to the asset if not found through proactive inspection. Preparing For Resident Turnover Ultimately, managing turn times is critical to decreasing overall vacancy. In order to achieve this, asset managers should inspect the property prior to resident move out to generate a preliminary scope of work. This inspection should be conducted very shortly after notification of lease termination and should be conducted by a team of hands on, qualified systems experts. Any pre-moveout inspection should begin with an assessment of the five major systems listed above to evaluate their expected remaining useful life. If any component has less than five years left of useful life, it is a candidate to be replaced, due to the resident “stickiness” mentioned previously. The useful life of systems depends on market, maintenance, and material cost and availability, so this step will take a qualified professional to assess. After the systems are evaluated, managers should then review paint, flooring, appliances, countertops, and fixtures, with an eye toward lining up crews during and after the resident moves out. A primary goal during any resident turnover is to replace high-wear items, such as carpet, with longer lasting hard surface flooring such as vinyl plank. While this generally costs more up front, these materials are proven to bring higher rent rates and last significantly longer. Carpet has an expected useful life of seven years and is often viable for less time in high traffic zones. Vinyl plank flooring can last for at least 20 years for only a nominal upfront cost increase compared to carpet. Replacing laminate or tile countertops with quartz also generates a high return on investment. Further, quartz will last through many turns, whereas laminate often needs replacement every one or two turns. The historical industry rule of thumb for SFR unit turnovers is one day per $1,000 of cost. At Atlas Real Estate, our team has been able to deliver turnovers below that cost, at an average of $4,500 and five-days per turnover. In today’s market, flush with labor and material shortages, very few operators are achieving the historical standard, so this achievement is particularly noteworthy. The Atlas team attributes much of this performance success to the smart decision making and proactive measures made before and during resident occupancy. A preventative approach, instead of a reactive asset management approach, will save money and decrease headaches for both the manager and the resident in the long run; and, of course, the property owner most of all.

Read More