Fix and Flip

Factors Affecting Fix and Flip Investors

But Help Is on the Way…Eventually by Rick Sharga Most fix-and-flip investors will agree that a housing market with high demand, low supply, low-cost capital, and rising prices is their ideal scenario. And generally speaking, that characterizes today’s market. But like many generalizations, this one does not hold up well upon further scrutiny. Partly, this is due to excesses in all the categories mentioned above. Supply of homes for sale—both new and existing homes—has never been lower. Homebuilders have under-built for the last decade, and existing homeowners have been staying put longer and longer: the average tenure of a homeowner today is almost 12 years, more than double the length of time a homeowner stayed in place a decade ago. And consumer psychology has also played a role, since prospective home sellers first hesitated to list their home during a global pandemic, and now are concerned that if they sell their home there is nothing for them to buy. At the same time, demand has been driven to a high level by demographics—namely, the largest cohort of Millennials (the largest generation in U.S. history) is rapidly approaching the prime age for home ownership. The COVID-19 pandemic played a role as well, accelerating the movement of urban renters to become suburban homeowners. Also driving demand were historically low mortgage rates. Sub-3% rates on 30-year, fixed-rate loans bolstered affordability, and in many cases made it less expensive to make a monthly mortgage payment than to pay rent. This huge supply/demand imbalance led to bidding wars, which in turn led to massive price increases (15% year-over-year), and to properties spending almost no time on the market. The median number of days-on-market dropped from almost 60 in June 2020 to 37 in June 2021 according to the Federal Reserve Bank of St. Louis. And in many markets, the actual days on market could be measured in weeks…or even days. So, all the factors that normally play out in favor of fix-and-flip investors have been so extreme that they have made it extraordinarily difficult for flippers to prosper. Limited supply is good; virtually no supply makes it hard to find anything to buy. Rising prices are good—they make it easier to capture ROI; prices that rise so fast they eat away all the margins are not so good. Low-cost capital is useful unless it turns traditional homebuyers into well-funded competitors for this limited inventory. Home Flipping Falls to Lowest Level in 20 Years It is probably not a surprise that the fix-and-flip market has flopped in recent quarters. According to a recent report from RealtyTrac’s parent company ATTOM Data Solutions, flips accounted for only 2.7% of home sales in the first quarter of 2021—the lowest level since 2000. This was down from 4.8% of home sales in the fourth quarter of 2020 and 7.5% of sales a year ago. The number of homes flipped dropped significantly, and so did the gross margins, due at least in part to the rapidly escalating cost to purchase a home. According to ATTOM, the gross profit on a flip in the first quarter of 2021 was 37.8%. This was down from 41.8% a year ago, and is the lowest margin reported by ATTOM since 2011. Unsurprisingly, ATTOM noted that the percentage of homes flipped dropped in over 70% of the markets covered in its report. There were two other interesting items in the ATTOM report, both of which reflect the reality of the current housing market. First, the percentage of homes purchased with cash by fix-and-flip investors jumped to just over 59%, highlighting the importance of being able to move immediately on a potential property without having to wait for financing. Second, the length of time between purchase and flip dropped to 159 days—the fastest turn times since the third quarter of 2013, and an indication of how strong demand from homebuyers is today. Help is on the Way…Eventually One of the factors undoubtedly hampering fix-and-flip investors today is not just the lack of inventory, it is the lack of foreclosure inventory. While foreclosure activity was running well below historical levels prior to the pandemic, the federal government’s foreclosure moratorium and CARES Act mortgage forbearance program effectively stopped almost all foreclosure actions over the past 18 months. In its mid-year foreclosure report, ATTOM concluded that foreclosure activity was down by 61% compared to the first half of 2020, and 78% compared to 2019. Fix-and-flip investors have historically been ideal buyers of foreclosure inventory, and part of a win/win situation for the housing market—buying below-market properties that needed repairs, getting the properties ready for occupancy, and selling them, often to first-time buyers. While there are other types of properties that fit this buy/fix/flip model such as homes from probate sales or bankruptcies, homes in previously underserved communities, and homes where the owners simply have not kept up with maintenance over the long term, foreclosure properties have been a mainstay for most flippers, and have been in increasingly short supply during the pandemic. That situation may be on the verge of changing. The Biden Administration has indicated that the foreclosure moratorium will have ended by July 31. The Consumer Finance Protection Bureau (CFPB) which regulates how mortgage servicers execute foreclosures, had been expected to put rules in place which effectively would have made it impossible to initiate foreclosure proceedings on defaulted borrowers until the end of 2021. But, somewhat surprisingly, the CFPB rules actually included several carve-outs that should result in foreclosure properties entering the market over the second half of the year. Specifically, the Bureau stipulated that loans that had been in foreclosure prior to the moratorium—some 250,000 in all—would be eligible for immediate processing, as would vacant and abandoned properties. The CFPB also allowed foreclosures to begin in cases where the borrower was “unresponsive” to servicer outreach, or where the servicer had exhausted all loan modification options unsuccessfully. At RealtyTrac, we are now expecting to see several small waves of foreclosures—one shortly after the moratorium expires, made up

Read More

Mid-Level Remodels to Get the Best ROI

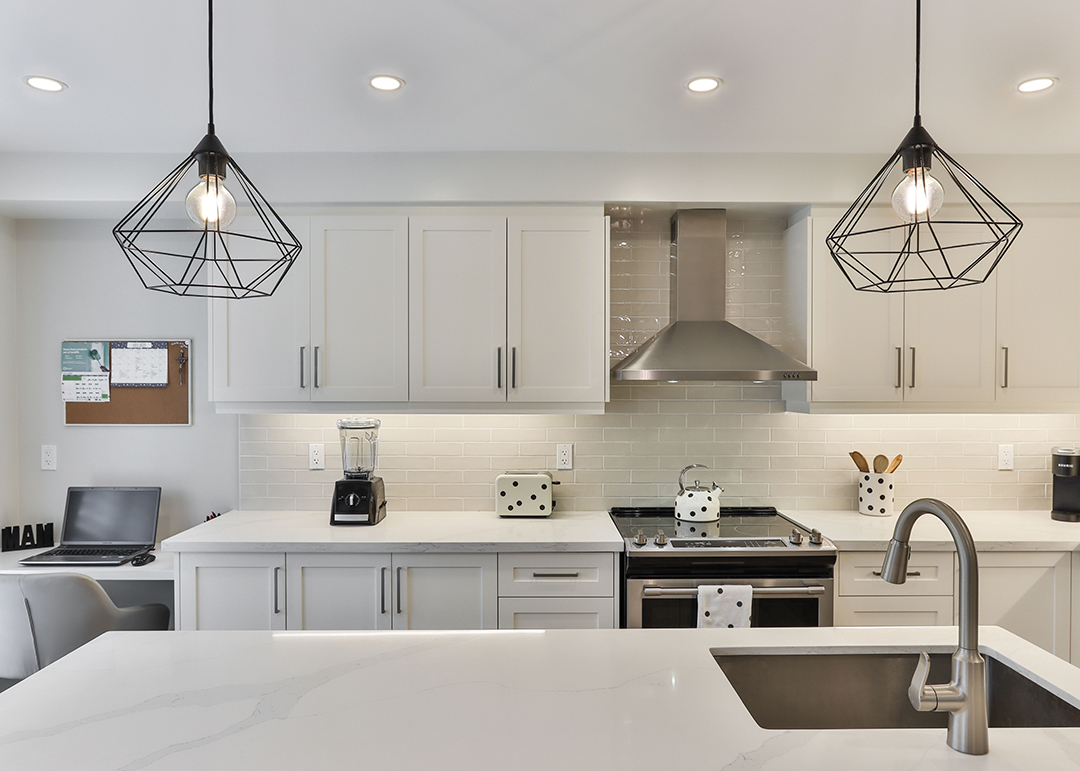
Work Smarter and Not Harder by Erica LaCentra Home flipping levels are not what they used to be. According to the first-quarter 2021 Home Flipping Report from ATTOM Data, only 2.7% of all home sales in Q1 of 2021, or 1 in 37 transactions were flips. That is the lowest level since 2000. According to the same report, that latest figure was down 4.8% from Q4 of 2020 and down 7.5% year-over-year. While flipping rates have been down overall for nearly the last year, the returns were still hefty. For those that were able to navigate inventory issues and find the right deals, flipping was still a very profitable venture. However, returns on home flips have also dropped in 2021. As the rate of flips has dropped, so have profits and profit margins, with the gross profit on a typical home standing at $63,500 in Q1 of 2021 versus $71,000 in Q4 of 2020. The market has finally gotten to a point where flipping homes has become very challenging to be worthwhile due to home prices that have spiked over the last year. Whether this is truly a downturn for the flipping industry or not is hard to say. With government intervention finally coming to an end, there are many possible ways that the housing market as well as the flip market may be affected. For those investors that are still looking to flip or maybe add some additional money into properties they currently own, there are definite areas to focus on that will give them more bang for their buck. So, what are those worthwhile ROI improvements? Minor Remodels of Major Areas When investors are reviewing what parts of a property should be rehabbed to ensure a good return, they should be thinking about the parts of a home that get the most use. The kitchen and bathrooms are the highest traffic areas and remodels of these rooms are typically going toprovide the greatest return. However, that does not mean that a major gut remodel is necessary to result in larger profit margins. Investors should be thinking about mid-level remodels to get the best ROI. For a kitchen, that would typically entail refacing or replacing kitchen cabinets, installing new countertops, putting in new faucets and fixtures and updating appliances. This level of renovation will cost, on average, around $20k–$25k versus a major kitchen renovation that can cost anywhere from $40k to $70k, saving an investor a tremendous amount of money on a project. For bathrooms, a similar approach can be taken. Fresh paint, refacing a vanity and new faucets and fixtures can go a long way towards giving this area of a home a facelift. If the layout of the space works and the essential parts of the bathroom are in good shape, there is no need to do a gut remodel. A basic remodel of a bathroom typically costs $10k versus a major bathroom remodel costing an average of $14k to 18k, again saving an investor money while still improving the space. Fresh Paint A fresh coat of interior paint has an average cost of $2k but according to HomeGain, an interior paint job can have sellers seeing up to an 107% return on investment. Choose colors with your end buyer in mind and stick to a more neutral color pallet. You will see the greatest return by choosing white, off-white, light grey, or tan paint colors throughout the home. This ensures that potential buyers can see the home as a blank canvas that is move in ready or is easy to paint over. Curb Appeal Focusing on curb appeal is a must! Because the exterior of the property is the first impression potential buyers get of a home, it makes sense that it is a good place to spend renovation dollars. According to a recent article from CNBC, the “majority of projects offering the greatest returns in resale value were related to curb appeal.” Something as simple as replacing garage doors showed a 94% return-on-investment. Other projects to consider include updating the siding, painting the exterior of the home or adding a manufactured stone veneer for a more appealing look.  Investors should also take landscaping into consideration. Not only will future buyers be looking at the home in person but usually an exterior shot of the home is the first thing they will see in the property listing. Attractive landscaping can add up to 28% to your home’s overall value, according to John Harris, a landscape economist. Finally, investors should be looking at basics such as repairing damaged fencing, repairing or re-staining an existing deck or porch, sprucing and cleaning up walkways and re-sodding anydead grass spots on the lawn. A little TLC spent on the outside of a property will ultimately bring in bigger returns. Lighting Interior and exterior lighting can have a significant impact on a potential buyer’s opinion of a home. Upgrading the lighting is another easy fix to modernize a property without major effort. Investors should find more modern and timeless fixtures. This will not only prove to be less expensive but will also have greater appeal for future buyers. Also, do not overlook smaller touches like updating outlets and switch plates. According to HomeGain, upgrading the lighting can see an ROI of close to 300%. Some other key projects include installing dimming switches in common rooms, increasing the wattage of all bulbs around the house and making sure the lighting functions properly. If there is room in the budget, consider investing in smart home technology, as well. Flooring According to Realtor.com, in 2019, homes that had hardwood floors sold for 2.5% more than homes with other types of flooring and provided an ROI of between 70% and 80%. Investors should consider ripping up existing carpets and spend the money to either refinish the underneath flooring (if hardwood) or put in new flooring. New flooring will make a home look more attractive and eliminate any smells or stains that may appear on

Read More

Choosing the Right Coverage

How It Can Make or Break Your Fix-and-Flip Investment by Jen Sitko Choosing the right real estate insurance to protect your investment projects can seem like a superfluous and unnecessary cost. After all, you want to sell the project as quickly as possible, so why opt for additional coverage? As a lender, Fund That Flip operates daily in the world of risk management, so we see firsthand where cutting corners for a lower cost leads to more trouble than it is worth. We’ll explore some of the supposedly “cost-saving” insurance missteps that could lead to disaster for your fix-and-flip project—and, more importantly, how you can leverage insurance to help minimize your risk and maximize the benefit to your business. Your Time is Money One of the most common mistakes when selecting an insurance policy is not carrying enough coverage on the property. As a real estate lender, we often see policies only written with enough coverage to protect the total monetary investment into a project (purchase cost plus your renovation budget). However, that calculation does not account for your time and labor, which, of course, are often some of the biggest costs for your business. While a total loss could be covered in this case, you will be left with nothing to show for the time you spent executing the project. …And Don’t Forget Replacement Costs Another oversight that real estate rehabbers often commit is failing to consider their estimated replacement costs. Insurance companies will evaluate based on that replacement cost, meaning it will be assessed on the cost if you were to knock down, excavate, and rebuild. If you choose to under-insure a property, you could potentially face coinsurance penalties and be shorted or denied claims if you fall below the standard 80% coinsurance clause. While not all coinsurance is 80/20, this is the most common, and the penalty will apply for any under-insured property, regardless of the ratio. Let’s take a closer look at an example: Your newest investment, a fix-and-flip, is evaluated at a $1,000,000 replacement cost by your insurance company, but to save on the premium, you only insure it for your anticipated sale price of $650,000. In this case, the home is under the 80% coinsurance clause ($800,000) and therefore, puts any claims you would make at risk for penalty and short payment.  When evaluating real estate insurance, be sure to consider your time, labor, and most importantly, your replacement costs when calculating your coverage. Accidents Can Happen Another common misstep when choosing insurance is failing to specify on the documentation that there will be renovations made to the property. As a real estate investor, you know that unintentional incidents can occur at any job site, even to the most meticulous and careful. That is why it is a good idea to explicitly document that you will be renovating the property when choosing insurance. A vacant homeowner’s policy will protect the property as it currently sits; however, it will not cover the renovations being made or claims or losses caused by the renovations themselves. Take care that any policy you take out includes a builder’s risk endorsement or language stating that the building improvements are covered.  When in Doubt, Choose the Special Form Now we’re really getting into esoteric knowledge. You may be surprised to learn that the actual form on which your policy is written matters. Special Form should always be your top choice so long as it is available. It is the broadest type of policy and coverage that you can secure, meaning that you basically are insured against any cause of loss that isn’t excluded on your form. If your agent says that Special Form is not available for the property in question, consider shopping your options. Not all agents may have knowledge or access to quoting you on a Special Form. Here’s an easy way to differentiate between the two: Special Form – if the policy does not specifically exclude a “cause of loss,” then it will be covered. Broad/Basic Form – if the policy does not list a specific “cause of loss” as covered, then it won’t be. Carrying General Liability in Addition to Property Coverage General liability coverage tends to be the less expensive portion of a premium, but investors may wonder why having this additional coverage is necessary when they are simply renovating a property. As a general rule, property coverage relates to the physical property, while liability relates to unforeseen events that leave the property owner open to risk. For example: If you or your realtor are showing a partially finished flip, and someone trips over exposed materials and causes themselves bodily harm, any potential lawsuits that might arise will likely name the owner of the home (which, since you’re working on the project, is you). In this case, general liability coverage will protect you. Your contractor likely carries general liability as well, but something many investors do not know is that, as the owner of the property, you still need the coverage individually and in the name of your LLC. Your contractor’s coverage only extends to bodily injury or property damage caused by their trade work. It does not insure the property you own and any claims that arise which are not directly related to them. While it can be tricky to navigate all the different options and types of insurance, choosing the plan that best fits your real estate investment project can be crucial to maximize your profits and give you a competitive edge. It is helpful to understand the choices available to you and which ones make sense for your business. Oftentimes, the options that might seem to be saving you time or money could ultimately have a negative impact on your project or business. Most importantly of all, make sure you partner with insurance providers who understand your real estate business and whom you can trust to give you the best plan for your needs.   

Read More

Riding the Market Wave

Fix and Flip Has Never Been More Profitable Than It Is Today by Craig Lasson The real estate market has become increasingly frantic, making fix and flip both more attractive to investors and more competitive. The winners in this market will be those with a good eye for value and a quick exit strategy. To get an idea of how hot the real estate market is, consider that in June of 2021, a waterfront house in Jupiter, Florida, purchased for $24 million was relisted by the new owner two days later for $30 million with every expectation that it would sell. Instead of the traditional “fix and flip,” some investors are simply skipping straight ahead to the flip stage in order to take advantage of rapidly increasing property prices. The Radian Home Price Index  According to the Radian Home Price Index (HPI) provided by Radian’s subsidiary Red Bell Real Estate, LLC, the number of existing homes on the market in the spring of 2021 was more than one-third lower than at the same time last year. High demand and low supply have inevitably driven prices skyward. From March through May 2021, home prices nationally rose 11.5% according to the HPI, with the median home price in the U.S. soaring to $280,002. And as prices rise, the speed of transactions is accelerating too. According to the HPI, nearly half (44%) of homes for sale in April were on the market for less than a week before going pending. Even deep-pocketed institutional investors are feeling the heat of this market. One investor revealed that even though they are submitting cash offers five percent above list price on average, their firm is winning only about 30% of bids. In fact, a record number of homes are selling over asking price. The HPI revealed that nearly half (45%) of homes were sold abovelist price in June 2021, up from 21% in June 2020. Reports of cutthroat bidding wars and offers exceeding $1 million over asking price have cropped up in recent months. In addition, fix and flip investors are also contending with the rising costs and timelines of renovation. A COVID-related materials shortage and increased demand has pushed the price of lumber up from about $400 per thousand board feet in February 2020 to a record high of more $1,600 in early May before settling back around $800. But even if you can afford the lumber, there is a severe shortage of laborers to do the work. The Bureau of Labor Statistics (BLS) reported in April there were 357,000 more construction jobs than there were workers. What Does the Future Hold? And yet, even with all these pressures—low inventory, institutional competition, increased labor costs—for some, fixing and flipping has never been more profitable than it is today, with some investors reporting profits up three-fold over last year. As long as home prices continue to rise faster than the cost of renovating, the fix and flip market will be well-positioned to ride the wave.     What is driving this market is a combination of secular trends that complement and build on each other. First, the COVID-19 pandemic accelerated a move out of urban areas as families and professionals sought more space to work from home. Others made long-distance moves for a more affordable lifestyle. States with a high cost of living like California and New York lost residents in 2020, while Texas, Florida and Arizona gained population. Adding fuel to the fire were historically low interest rates and low inventory, which sparked fierce competition among those looking to make moves.    With so much activity in the housing market, it is reasonable to ask: Is this a bubble like the one that triggered the Great Financial Crisis? Many housing experts—including the chief economist of the National Association of Realtors®—say no. For one thing, the fundamentals are very different today. Stricter lending standards have improved the quality of mortgage loans approved after 2008 and reduced risk in the market. The gradual return to pre-pandemic life is taking a bit of the anxious edge off the market, and as prices rise, more and more people are simply priced out of the market, reducing demand. But fear of being caught mid-renovation when the market cools can make fixing and flipping seem like a high-stakes game of musical chairs. The typical 90-day sweet spot between acquisition and sale is increasingly harder to hit because of the shortage of skilled contractors. Cosmetic improvements take less time, but complete tear downs can take more than a year. And as more days go by, the hard costs of financing begin to add up and the risk of a market correction increases. In the face of such uncertainty, the real estate axiom, “make your money on the purchase” has never been more true or more relevant. If you can find a good deal, you will have more options that could increase the likelihood of making money on the back end. Alternatively, you could skip straight to the flip without any rehabbing at all, just like thatoptimistic speculator in Jupiter, Florida looking for a $6 million payoff after 48 hours. In thismarket, stranger things have happened. 

Read More

Profitable Fix and Flip Properties

How to Find Them in Today’s Market   by Gunnar Blix With today’s record-low housing supply and unprecedented home-price growth, investors who fix and flip properties face a difficult challenge. Consumers, worried that housing affordability will soon be out of reach, want in on the market now, especially while interest rates are low. Bidding wars are prevalent on many properties—including fixer-uppers that used to primarily only interest investors. As a result, it’s hard to find residential properties to flip—even distressed ones—at the prices needed for a healthy profit. Fix and flip investors are feeling the heat, with data showing that overall flip-sales rates are down. In the current environment, where can investors still find viable properties to fix and flip? Beyond that, how can investors identify locations where properties are less likely to yield a profit? More than ever, data and analytics can play a crucial role in helping to inform investment questions and decisions. The right data can help identify markets that still offer opportunities as well as those that have stalled. Using Black Knight’s comprehensive public-records deed information, and MLS data, we gleaned important insights about local-market flipping activity at the CBSA level. Our Home Price Index and automated valuation models (AVMs) added context to the analysis, for a deeper understanding of area price trends. While a manual search of this information would be daunting, Black Knight’s technology enabled us to analyze the data on a single platform and quickly generate the results in easy-to-read visuals. How Prevalent is Flipping? While overall flipping activity has decreased across the U.S., some locations are still experiencing relatively high flip-sales rates (defined as the ratio of flip sales to total of existing single-family residential and condominium sales). Flip sales ranged from being essentially non-existent in some markets to reaching above 15% of sales in other markets following the Great Recession. Some of the markets currently experiencing the highest flip-sales rates are in the Western U.S., with the Phoenix metro area leading the way at 8.0%, followed by the Tucson metro area at 7.4%. How Has Flipping Changed? Over the last year, we experienced consistent declines in flip-sales rates across most of the largest U.S. metro areas. The map below shows the first quarter 2020 to 2021 year-to-year change in the flip sales rate by metro area, measured in basis points (hundredths of a percentage point). Most areas are “in the red,” indicating slowing flip sales. There are noticeable declines along the California coast and in larger metro areas in the Northeast, including Boston, New York and Washington D.C., and along the east coast of Florida and Texas Gulf Coast. There are also areas of flip-sales growth, indicated in green. For example, Flagstaff, Arizona, and Española, New Mexico are experiencing a surge in flips as the local markets see renewed interest, good inventories and strong price growth. Metro areas adjacent to Denver and Reno are benefitting from being on the fringes of second-home markets where inventories are tight. We can get a sense of the potential to profit from flips by analyzing the delta between purchase and sales price. This represents the gross profits, and significantly overestimates the net profits investors realize. Investors incur not only the costs of needed updates, but buying, carrying and selling costs that can easily top $30,000 or more. Nevertheless, the gross return on investment (ROI) indicates how likely investors are to realize gains, and the change in the gross ROI confirms if markets are becoming more or less profitable. The trends clarify where profits may be going up, slowing down, or staying the same, and can help inform property-purchase decisions. The map below confirms that some markets where flipping became less prevalent last year—like Los Angeles, San Diego and Washington, D.C.—showed a drop in ROI. But this is not consistent across all markets. Denver, Miami, Atlanta and New York, where flipping decreased, are showing (at least weakly) improving ROI. In other markets where flipping is increasing—such as Flagstaff—profits appear to be decreasing. Finally, a few smaller metro areas such as Madison, Wisconsin, are showing both an increase in flipping and ROI. Investors need more information than just the gross ROI growth of a market to make sound investments. The sweet spot for flipping relies on several factors working together to create market opportunities. The market must support rising home prices to afford investors a high potential for profits, as indicated by rising home price trends. However, markets can become too hot or too tight for investors to buy at depressed prices, which is currently the case in many markets. One factor correlating strongly with profitable flipping markets is the share of distressed real-estate sales, shown in the map below. Investors should keep an eye on MLS statistics, like average time on market and months’ supply of inventory to support the timing of their decisions. Examples of Changing Markets Two example markets may help illustrate the trends. Flipping in San Francisco boomed after the financial crisis on a glut of distressed inventory. For several years, flip-sales rates hovered in the teens, topping out at 15%. However, since 2013, flipping in San Francisco has declined as inventories dried up, home prices soared, and restrictions and lack of buildable land prevented new construction. The Denver metro area saw a rise in flip rates following the financial crisis, but on a much more moderate scale. Flipping rates have largely held steady since, with the expected seasonal variations. Overall, the Denver market appears to leave room for profitable flips. The Right Tools Despite today’s housing supply and purchase prices, there are still locations where investors can purchase viable flips and likely turn a profit. More than ever, though, local market conditions need to be just right—and that’s where data and analytics can play a key role in informing decisions. With the right data and analytic tools, investors can easily discern local market trends and current conditions. Fortunately, this type of data is readily available from technology and data companies that focus

Read More