Demystifying Property Analysis
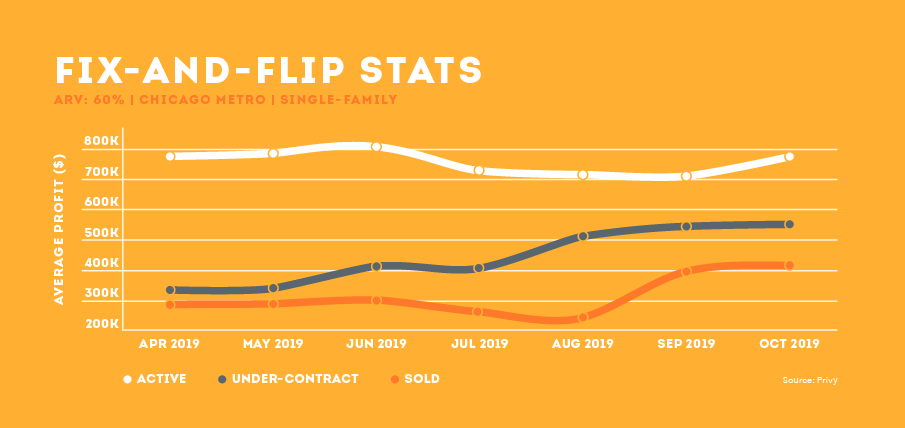
Understanding property analysis can be the difference between a big profit and losing everything. By Scott Fahl Property analysis has long been a subjective practice, with as many different opinions on best practices as there are properties. Getting it right can mean the difference between a big profit and losing everything. Why is it so difficult to get an accurate property value? Surely with all the billions that have been thrown at the problem, there must be someone with a solution. Right? For decades, companies and individuals have been working to create the Holy Grail for accurately appraising properties using Automated Valuation Models (AVMs). Automated Valuation Models The AVM model uses mathematical modeling combined with databases to attempt to predict a property’s value at a certain point in time. In a nutshell, the model is trying to pull accurate comps. The more precise the comps, the more accurately they can predict the property’s value. The AVM model sounds good on paper. But it falls apart rather quickly when you realize finding accurate comps is much more complicated than the price per square foot, selling price and proximity to subject property. To lay it out for you, mathematical models can’t tell you that Property A was well taken care of by one owner who is a carpenter by trade and pulled permits for all the work he’s done and that Property B’s owner isn’t a carpenter, pulled zero permits and may or may not have redone the electrical. The AVM models are getting better because they have much more access today to data. But, unless you can get homeowners to willingly provide data about their property on a regular basis, AVM models will always have a margin of error and in some cases a large margin of error. Investor Success Model Now, move the conversation to investment properties and everything changes. Owner-occupants are looking for things like demographics, noise, schools, traffic, walk-score, number of restaurants, grocery stores, dog parks, bus routes, biking trails, crime, etc., etc., etc. For investors, it’s simple: They are looking for one thing—profits! You can make an argument that investors should also be looking at the list of what owner-occupants want since it’s the owner-occupants who will be purchasing or renting the investment properties. Good point. But today’s real estate investment tech companies argue that you are overcomplicating things. They claim they can cut out 95% of the confusion most investors face when analyzing a property’s investment potential by changing the conversation from demographics and AVMs to focusing on what other investors are having success with. Looking at where investors are buying, what they are paying, what they are doing to properties (construction levels) and what they are selling or renting them for gives you just about all the information you need. A key piece to understand is this: When investors set the tone for an area (investment strategy, purchase price, rental rates, remodel levels, selling price, etc.), it gives you a near-exact game plan for what works and what doesn’t, virtually eliminating the need for inaccurate AVMs and demographics analysis. The reason this works so well is the investors are creating comparable consistency. Example: Investors A, B, and C all bought in the same area, around the same time, around the same price, added similar upgrades with similar finishes and sold near the same prices. If you find a similar home in the same area, in a similar condition and a similar price point to A, B and C, how long should it take you to decipher that it’s a good investment? The answer? Minutes! With this model, you know the best investment strategy for the area, what to pay, what level of construction is appropriate and what you can sell the property for. This level of comparable consistency removes the variables and equations that cause inaccuracies. If all comps are created equal, then AVM models would be extremely accurate. The problem for owner-occupant AVMs is when you add years of wear and tear, upgrades, additions, lifestyles, pets, etc., it becomes very difficult to determine how closely owner-occupant comps are to one another. Without going inside each property, you’re left to make assumptions that dramatically increase your investment risk—and at some point, that is going to bite you. When using consistent comparables, you can make confident, low-risk, data-driven, educated decisions in minutes. Tracking Consistent Comparables This model of using consistent comparables is achieved by using sophisticated and proprietary algorithms and substantial data sets. The results go way beyond valuing a single property and can go as far as assessing the investment potential of an entire nation—in seconds! Tracking investment activity on a national level can currently be done. But it’s mostly left to the behemoth data aggregators and delivered in the form of monthly, quarterly or yearly reports to the public or more detailed reports to institutions. These reports will tell you things like foreclosures are on the rise. Or, the fix-and-flip market is up 10% in Dallas/Fort Worth. Or, rental rates are increasing in Denver. This sort of data has its usefulness. But it’s not much help to those in the trenches practicing investment real estate every day (investors, realtors, appraisers, hard money lenders, etc.). It’s simply too vague. Today new technologies are filling in the gap by providing real time investment market analysis for the entire nation as well as down to the street level with the click of a button. It starts with bigger, better, more accurate data sources and is taken to next-level usefulness by cutting-edge technology companies who specialize in creating user-friendly software tools that solve widespread industry problems. These tools are not simply regurgitating their findings but have opened the door to allow users to create their own findings by entering their individual needs and parameters. An example of this could be: Show me every property in Chicago that was flipped in the last six months and was originally purchased for 60% of the after-repair-value (ARV). Show me the
Read More