A Different Vision for Housing

A Unique Strategy Keeps American Homes 4 Rent Ahead of the Curve by Carole VanSickle Ellis American Homes 4 Rent is a relatively young company. First conceptualized in 2011 when national indices were ranking “improvements” in housing based on the degree to which a market was losing in the single digits instead of double ones, the company was the first Wall Street institution to snap up single-family homes during the Great Recession. That was not at all what American Homes 4 Rent intended to do, however. The founders’ ability to view opportunities and potential threats in the housing market from a completely different angle than the rest of the financial powerhouses of that era has set American Homes 4 Rent apart ever since. “When we formed American Homes 4 Rent, we had a very different vision than that of our peers later,” recalled David Singelyn, CEO and trustee for the company. “While they viewed the 2011 market as an opportunity to buy houses at an attractive price and resell later when the market recovered, essentially taking the opportunity as a trade, we saw it as a chance to acquire homes and create a platform that would truly scale over time while offering residents a chance to live in desirable, affordable homes and investors a chance to invest in a company complete with its own drivers to growth.” Replicating Success by Starting “From Scratch” American Homes 4 Rent was first conceptualized in 2011 by American self-storage billionaire B. Wayne Hughes, who is ubiquitously referred to by his middle name. Hughes served as chairman of the board from the company’s founding in 2012 until 2019, when he retired at the age of 85. By that time, the company had nearly 53,000 single-family rental homes under management and was providing housing to roughly 200,000 residents while creating more than $1 billion in annual revenue. Singelyn credits the company’s wild success in residential real estate to leadership figures who understand many aspects of the real estate market and have great experience and successful track records in other sectors of the market. Hughes himself had founded one of the nation’s largest real estate investment trusts (REITs), Public Storage, four decades prior to launching American Homes 4 Rent and had founded a real estate company, American Commercial Equities, that owns and manages retail and office properties in California and Hawaii. “In 2011, when even the biggest Wall Street firms were still learning the business, our management and leadership teams were made up of people who had historically been operators of real estate and had cut their teeth on consumer-related real estate,” Singelyn explained. Because of this deep well of experience, early leaders at the company believed it would be important to “start from scratch” when it came to creating the American Homes 4 Rent operating platform and setting the stage for its growth drivers. “We went through a number of life cycle events to get where we are today,” Singelyn said. “In the early days, we were in the middle of a land and property rush while also building the operating system from the ground up. It was all done from scratch.” The company needed a completely new take on existing operating platforms because it planned to institutionalize single-family rentals – not sell its properties when the market recovered. “We did constantly evaluate what had been successful in Public Storage and other ventures in which our founders had been involved, but that led us to focus on achieving financial flexibility rather than trying to utilize an existing system that did not fit the new company’s needs,” Singelyn explained. Access to Capital  Financial flexibility manifested as a simple concept and goal: access to capital (and assets to acquire at an appropriate price point using that capital) at all times. Because American Homes 4 Rent looks at its acquisitions in a more permanent light than other institutions in the industry, it is imperative the company always has the financial wherewithal to acquire more properties to grow the business and generate returns. This has led to some creative and far-reaching problem-solving as the national housing market has recovered since 2011. “About four years ago, we were in a strong growth phase when we realized that the ability to buy single-family homes at attractive prices and below replacement costs was becoming less viable each year as price appreciation recovered from the housing crisis in 2008,” Singelyn recalled. “We realized we had to make sure we had adequate channels of growth in our future, and that meant multiple points of access to capital.” The company immediately began cultivating and refining three channels to capital and acquisition: buying existing homes (the “traditional channel”), acquiring brand new homes from national builders, and developing new neighborhoods via the burgeoning build-to-rent model. “We started testing the build-to-rent concept wherein we would acquire land, work with our own development team, and build homes specifically for rental,” Singelyn explained. Although the term “build-to-rent” is ubiquitous today, at the time American Homes 4 Rent was far ahead of the curve. The company’s rental homes are also a far cry from other new builds when it comes to bringing value to owners and residents because they are built with preventative maintenance and longevity in mind (see sidebar). “These are higher entry-level homes than you will see if you buy conventional new construction,” Singelyn said. “We use materials that create a better maintenance experience for ourselves in the long term, that are better for the resident because they are cleaner and more visually appealing, and that are better for the environment because they do not have to be replaced as often, if at all.” Build-to-rent strategies have another advantage when deployed en masse in the manner in which American Homes 4 Rent has done: They offer dramatic advantages associated with efficiencies of scale. The company often builds 50 or 100 contiguous homes in the same neighborhood, which enables residents to enjoy many of the amenities that would normally come

Read More

Are High Prices and Low Inventory Changing the SFR Market?

by Rebecca Smith It is fair to say that never has a New Year been so anticipated or so welcomed. 2020 was unprecedented and challenging for almost everyone. The coronavirus threatened the health of millions of people and economies around the world. In our industry, the market for single family rentals (SFR) was buffeted by changing preferences and grim market realities. That did not put a halt on activity. On the contrary, low rates and available liquidity meant a very active year in SFRs for owners and lenders alike. Not only did the market see a record-breaking number of securitizations completed during the year, but it also saw the largest securitization ever to come to market—more than 14,000 assets—successfully close in 2020. REIT Performance SFR Real Estate Investment Trusts (REITs) have been one of the top-performing real estate sectors throughout the pandemic. This was due to several merging factors and secular trends, including the migration of the millennial generation, the largest age cohort in American history, out of cities. These factors are putting enormous pressure on the market and changing the way some industry players are pursuing acquisitions in what looks to be a period of dwindling opportunities. Across the country, inventories are low, and prices are high, as existing homeowners stay put to ride out the pandemic and urban renters move to the suburbs to rent or purchase homes themselves. Adding to the pressure, U.S. private equity real estate funds are sitting on more than $150 billion of unspent cash according to Green Street, a real estate advisory firm, as reported in The Wall Street Journal. With core holdings such as hotels and office buildings having uncertain prospects, fund managers are increasingly looking to single-family homes for growth. The Operators So, how are these pressures affecting operators? Some are changing up their buy boxes and exploring new markets.  The challenge of acquiring in the current market remains in terms of increased prices and low inventory. However, “self-made” challenges to growth strategies are adding to the pressure. With the eagerness to securitize at the current rates, many of the larger aggregators have exhausted their current inventory which has also led to a scramble to acquire new inventory in bulk through M&A activity.  With so much money chasing limited SFR opportunities, something needs to give.  We are seeing that play out among mid-sized operators. Because of a severe lack of inventory, these industry players are turning to each other for growth to increase acquisitions, grow portfolios, and eventually securitize. In October, for example, real estate manager Pretium Partners LLC and Ares Management announced a $2.4 billion investment to acquire and take private Front Yard Residential Corp. In other cases, mid-size operators are leaning heavily on portfolio acquisitions from smaller operators and competitors to achieve their growth targets. Some of the larger institutional players are overcoming the inventory shortage by creating it themselves. In the Las Vegas area, one of the biggest landlords, American Homes 4 Rent, built two rental projects totaling more than 65 houses in 2020 and is planning more this year. And that follows a similar pattern of build to rent properties across the country. The industry is watching closely to see what happens to available inventories when COVID-related foreclosure and eviction moratoriums are lifted as expected early this year. However, with more homeowners having greater equity after a year of explosive appreciation and the sheer volume of forbearances in effect, the potential for further market gyrations is unknown. Regardless of what happens this year, 2020 marked the maturation of single-family rentals into a recognized and highly valued asset class. That may be the one constant in a highly dynamic market. 

Read More

You Can’t Buy What’s Not for Sale

Will Investors Find Inventory in 2021? by Rick Sharga One of the biggest challenges facing real estate investors is the lack of available inventory. According to the National Association of Realtors® (NAR), the number of homes for sale at the end of October 2020 was 1.42 million units, down 2.7% from September and down almost 20% from October 2019. The NAR report notes that unsold inventory is at an all-time low of 2.5 months’ supply, down from 3.9 months a year ago, and almost 70% below the 6 months of inventory available for sale in a normal, healthy housing market. Investors also find themselves in intense competition with homebuyers, who have returned to the market with a vengeance after staying on the sidelines due to the shelter-in-place orders issued after the COVID-19 pandemic was declared in March. Homebuyer demand is being driven in part by demographics, as Millennials reach prime homebuying age, and in part, ironically, by the pandemic itself. Searching for more space to accommodate the need for home offices and healthier environments for growing families, renters are abandoning high-cost, high-density urban markets to become homeowners in the suburbs. All of this demand increases competition for the limited number of properties for sale, driving prices to all-time highs – a daunting challenge for investors, whose profits depend on their ability to buy cost-effectively. The NAR report notes that the median price of a home rose to $313,000 in October, up 15.5% from the prior year. The California Association of Realtors® (CAR) reported sales results that were equally challenging for investors. Median home prices in November “dipped below $700,000 for the first time in four months.” But at $699,000, prices were still more than 18% higher than in November 2019. CAR also reported that inventory, at less than one month’s supply, was the lowest it’s been in over 16 years, and properties listed for sale were typically purchased within 9 days. For homebuyers, the record high home prices have been offset by historically low mortgage rates—Freddie Mac reported rates as low as 2.67% on a 30-year fixed rate mortgage and 2.21% on a 15-year fixed rate loan. These rates, however, have also increased demand, which ultimately will raise prices beyond affordability for many owner-occupants, and dramatically reduce margins for investor buyers. Low inventory, high demand from consumer homebuyers and escalating prices combine to make a fairly toxic environment for real estate investors. Will 2021 be any better? Is Help on the Way from Homebuilders? Homebuilders are benefitting from the surge in demand from buyers, with new home sales well above 2020 forecasts. New home construction has lagged behind historic levels ever since the Great Recession, with many economists suggesting that there was a housing deficit of between 300,000-400,000 per year for the last few years. In recent months, however, single family housing starts and building permits have both been heading in the right direction. According to Census Bureau data, there were almost 1.2 million single family housing starts in November—a 27% increase from the prior year, and the highest number of single family starts since 2007.Housing permits were up 8.5% year-over-year, with 1.1 million of those permits issued for single family homes. Most new home inventory will go to owner-occupants rather than investors; but adding a million or more new homes to the housing stock in 2021 will free up existing homes from “move up” buyers, which should make at least some properties available for investor purchases. Will Sheltering-in-Place Result in a Surge of Homes for Sale? Why is the inventory of existing homes for sale at record lows? Many industry analysts believe that COVID-19 has been a major reason. Research suggests that many homeowners are reluctant to put their properties on the market during the pandemic, as they’re uncomfortable with strangers traipsing through their homes. Similarly, homeowners who might be inclined to sell their homes aren’t excited about the prospect of visiting other properties, owned by people they don’t know. And finally, many people are concerned about the stability of their jobs due to the pandemic-induced recession and have decided to stay put rather than buy a new home and take on a larger financial commitment. It’s reasonable to assume that at least some of the homeowners who have been sheltering-in-place will decide to sell their homes in 2021, once it seems like the pandemic is under control. While the inventory of homes for sale has hovered around 4 months’ supply since 2016, even a return to that level would bring many thousands of properties onto the market, providing much-needed relief to the severe supply/demand imbalance that exists today. Will Distressed Properties Flood the Market? There will definitely be an increase in mortgage defaults—to suggest otherwise in an economy that shed 20 million jobs would be ridiculous. But investors shouldn’t count on another foreclosure tsunami in 2021, or an over-abundance of deeply discounted properties to choose from. First, the CARES Act virtually eliminates foreclosure activity (specifically on the 65% of mortgages that are backed by the government) through the end of 2020, with a high probability of this moratorium being extended for at least a few months. Separately, the mortgage forbearance program included in the Act has probably spared several million financially-impacted borrowers from facing default by allowing them to defer mortgage payments forup to 360 days. What happens when these programs unwind? Well, according to the Mortgage Bankers Association, more than 87% of the borrowers who exited from the forbearance program between July and early December did so successfully – having their loan reinstated or having a repayment plan in place. If those numbers hold through March 2021, when the majority of borrowers in the program are scheduled to have exited, it means that approximately 325,000 borrowers will leave forbearance at risk of default—a large number, but nothing like the millions of loans that were foreclosed on during the Great Recession. There were about 250,000 loans in foreclosure prior to the pandemic, before the various moratoria were

Read More

Increasing Curb Appeal

Setting the Mood for Showing Your House by Shannon McNabb First Impressions The old saying always seems to ring true and that is that first impressions are particularly important, and they last. Houses listed for sale currently are often posted online and “for sale” signs are placed in front of the home. When potential buyers pull up to the home, what they see first is crucial because it is going to set the whole mood for the showing of the house. Curb appeal is vital when it comes to marketing your investment. Picking the right paint scheme One of the many things you can do to increase curb appeal to prospective buyers is exterior painting. So, what is the right scheme? Are you in a more urban area or a more traditional area?  The aesthetic you choose for your house needs to match what is going on in the surrounding area.  Regardless of what is currently trendy, you can always spark interest with a “pop” color, a color that makes your house stand out from the rest. Maybe a navy-blue front door with matching shutters.  Personally, the favorite for this writer is a beautiful yellow with a nice color on the shutters that makes sense. Your comps in the area will help determine what is trending, and right now, “pop” colors are trending.  One thing we have seen recently is painting a brick house. It is a cost-effective enhancement that gives your property something extra that the house next door does not have. Doing something, anything, for the landscape of the property Overgrown yards are often noticed, not only by the neighbors, but also by your prospective home buyers. When thinking about landscapes for the potential homebuyer, think about what can be easily maintained by them in the future. Spruce up the garden beds with fresh mulch and a nice perennial that can withstand your region’s climate changes. Make it easy for them and let them know that the upkeep can be simple. Plant a few easily maintained trees to add some life to the property. Add some stonework to define paths and emphasize the areas that have been added to make that first great impression. A little bit can go an awfully long way. Staging for your desired audience Perhaps your budget does not include exterior repairs or professional landscaping. Or maybe the house does not need a lot of exterior work. Another way to make your property appealing and welcoming is by adding a feature that makes the future homebuyer know that this could be their home. By simply adding a seasonal wreath or a nice outdoor patio set can show prospective buyers that your home can be their home, something they can add their personal touch to and make it theirs. Make sure that what you choose for the exterior can be for any family type. This could range from a full exterior set (for a front porch) or even a nice accent piece such as a beautiful potted plant (for limited space). So, how important are first impressions? The first impression of your property can mean everything to the person looking at it.  It can be the difference between a “sale” and a “no-sale”. It can show them the possibilities, or it could show them that it is not for them. Make sure that your home is inviting and that everybody is always welcome. And besides getting top dollar for your investment, that is what we all want. 

Read More

Home Flipping Continues to Decline in Third Quarter

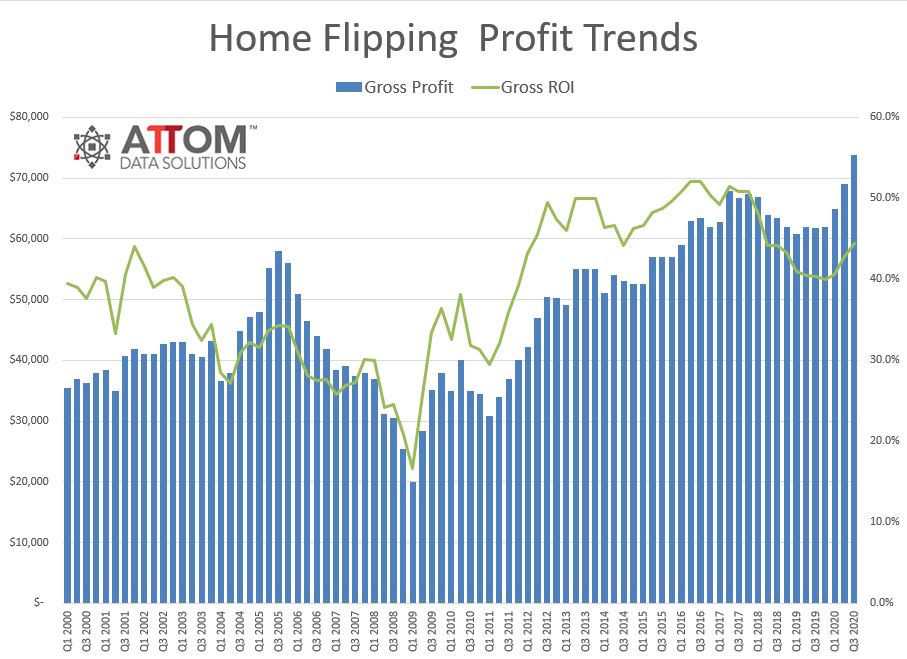
…But Profits Reach New High ATTOM Data Solutions released its third-quarter 2020 U.S. Home Flipping Report showing that 57,155 single-family homes and condominiums in the United States were flipped in the third quarter of 2020. Those transactions represented 5.1 percent of all home sales in the third quarter of 2020, or one in 20 transactions. That figure was down from 6.7 percent of all home sales in the nation during the second quarter of 2020, or one in 15, and from 5.5 percent, or one in 18 sales, in the third quarter of last year. While the home-flipping rate dropped again in third quarter, both profits and profit margins increased. The gross profit on the typical home flip nationwide (the difference between the median sales price and the median paid by investors) rose in the third quarter of 2020 to $73,766—the highest amount since at least 2000. That amount was up from $69,000 in the second quarter of 2020 and from $61,800 in the third quarter of last year. The gain pushed profit margins up, with the typical gross flipping profit of $73,766 in the third quarter translating into a 44.4 percent return on investment compared to the original acquisition price. The gross flipping ROI was up from 42.9 percent in the second quarter of 2020 and 40.3 percent a year ago. The improvement in the typical ROI marked the second consecutive year-over-year increase following nine straight quarters of declines. The continuation of opposing trends, with flipping rates down but profits up, reflected broader national housing market patterns as the worldwide Coronavirus continued spreading across the United States. Home prices kept soaring throughout most of the country in the third quarter as buyers—often seeking larger or more wide-open spaces—chased a dwindling supply of homes for sale. Rising values continued pushing a nine-year boom in the housing market even as much of the economy struggled to overcome high unemployment and other damage from the pandemic. “Home-flipping again generated higher profits on less transactions across the United States in the third quarter of 2020 as investors continued to make more money on a declining number of deals,” said Todd Teta, chief product officer at ATTOM Data Solutions. “This all happened in the context of the pandemic, which has created unusual circumstances for the housing market to thrive, and that has included the home-flipping business. Too much is uncertain these days to say whether the latest trends will continue. But for now, the prospects continue looking up for home flipping after a period when they were trending the opposite way.” Home flipping rates down in more than 90 percent of local markets Home flips as a portion of all home sales decreased from the second to the third quarter of 2020 in 148 of the 159 metropolitan statistical areas analyzed in the report (93.1 percent). (Metro areas were included if they had a population of 200,000 or more and at least 50 home flips in the third quarter of 2020.) Among those metro areas, the largest quarterly decreases in the home flipping rate came in Killeen, TX (rate down 44.5 percent); Savannah, GA (down 43 percent); York, PA (down 42 percent); Greeley, CO (down 41.5 percent) and Springfield, MA (down 39.8 percent). The biggest quarterly flipping-rate decreases in 53 metro areas with a population of 1 million or more were in Raleigh, NC (rate down 39.1 percent); Atlanta, GA (down 38.5 percent); Kansas City, MO (down 38.3 percent); San Diego, CA (down 38.1 percent) and Rochester, NY (down 37 percent). The biggest increases in home-flipping rates were in Davenport, IA (rate up 18.5 percent); Hilton Head, SC (up 16.8 percent); Scranton, PA (up 12.2 percent); Amarillo, TX (up 10.9 percent) and Kalamazoo, MI (up 7.7 percent). Typical home flipping returns rise in two-thirds of markets Homes flipped in the third quarter of 2020 were sold for a median price of $240,000, with a gross flipping profit of $73,766 above the median investor purchase price of $166,234. That gross-profit figure was up from $69,000 in the second quarter of 2020 and from $61,800 in the third quarter of last year. The increase boosted the typical return on investment in the third quarter of 2020 to 44.4 percent, up from 42.9 percent in the second quarter of 2020 and from 40.3 a year ago. The ROI in the third quarter stood at its highest point since the first quarter of 2018, when it was 48 percent. Home flipping profit margins increased from the third quarter of 2019 to the third quarter of 2020 in 104 of the 159 metro areas with enough data to analyze (65.4 percent). Markets with the biggest gains included Brownsville, TX (return on investment up 182.9 percent); Austin, TX (up 176.4 percent); Waco, TX (up 157.4 percent); Springfield, MO (up 145.3 percent) and Savannah, GA (up 143.6 percent). Aside from Austin, TX, metro areas with a population of at least 1 million that had the biggest annual increases in flipping profit margins in the third quarter of 2020 were Raleigh, NC (ROI up 74 percent); Phoenix, AZ (up 69.8 percent); Kansas City, MO (up 55.9 percent)and Las Vegas, NV (up 54.4 percent). The biggest year-over-year declines in investment returns on home flips during the third quarter of 2020 were in Corpus Christi, TX (ROI down 77 percent); Hilton Head, SC (down 72.9 percent); Boulder, CO (down 69.1 percent); Wilmington, NC (down 58.9 percent) and South Bend, IN (down 54.1 percent). Investors sell for at least double their purchase price in 14 markets Median resale prices on home flips in the third quarter of 2020 were at least twice the median investor purchase prices compared to a year earlier in 14 of the 159 metro areas with enough data to analyze (8.8 percent). They were led by Pittsburgh, PA (151.9 percent return, up from 127.9 percent in the third quarter of 2019); Hickory, NC (136.3 percent return, up from 110.3 percent a year ago); Scranton, PA (117.1 percent return, up from

Read More

Leveraging Big Data in Real Estate Investing

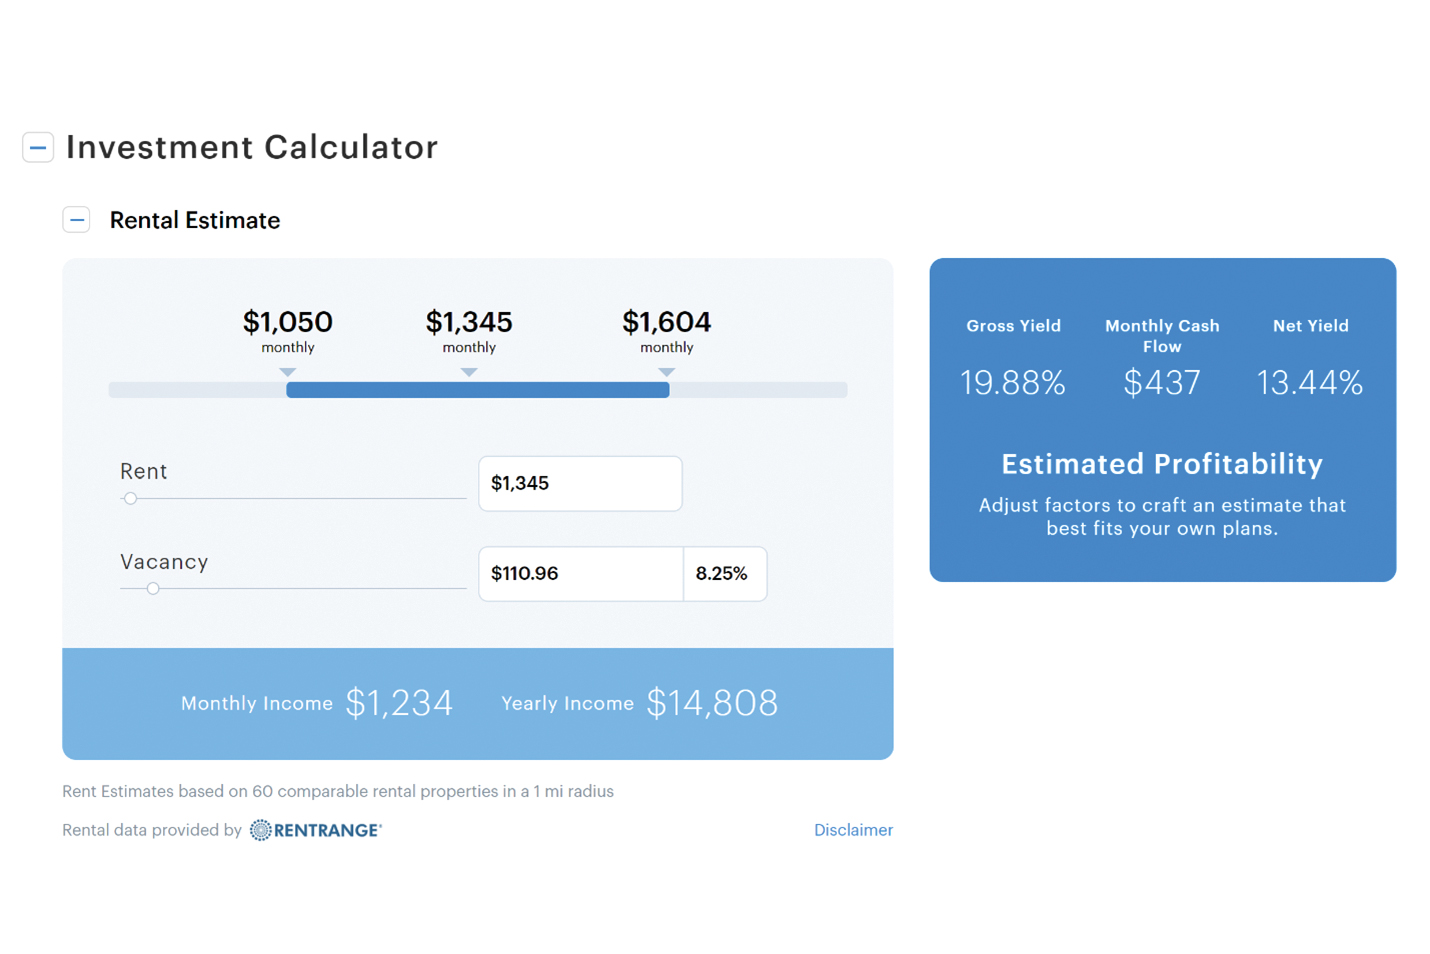
Post COVID-19 Forbearance & Foreclosure/Eviction Moratoria by Michael Jansta Let’s face it, nobody had 20:20 vision for real estate investing going into 2020. Now in 2021, even after all that we’ve seen and learned in 2020, our vision forward doesn’t appear much clearer. What we do see is COVID-19 continuing to rage on in all parts of the country despite vaccines in deployment, mortgage forbearance programs set to close but with the possibility of extension and moratoria on foreclosures and evictions extended until the end of January 2021 but also with a possibility (if not a probability) of being extended. Moratoriums on foreclosures put a stop to foreclosure sales in courtrooms and on the courthouse steps across the country. A mere trickle returned as abandoned/vacated homes and land were allowed to proceed to sale in some parts of the country. The double-whammy came from occupied REO and HUD’s Claims Without Conveyance of Title (CWCOT). A major source of post-foreclosure investor stock was hit by a nationwide eviction moratorium. With an eviction moratorium in place and continual extensions of that moratorium, attaining occupancy became virtually impossible to forecast. Basically, the acquisition of foreclosure sales and occupied post-foreclosure properties became exponentially riskier. Investors looking for distressed real estate were forced to turn to the retail market where demand was surging due to lack of inventory and historically low interest rates or compete over the small amount of existing pre-COVID vacant REO stock on or coming to market through property preservation channels. As of Dec. 6, 5.48% of active loans were in forbearance, according to the MBA, and trending down. This totaled approximately 2.7 million mortgages. At the same time, new forbearances requests hit their highest levels since early August showing that an increased COVID-19 surge is leading more homeowners to seek relief. This trend late in the year could be homeowners seeing protection as the window to enter a forbearance plan was scheduled to end on Dec. 31st. If the trend continues, we could see further extensions of forbearance options for affected homeowners. Either way, it still means that fewer homes will be headed to foreclosure in Q1 and Q2 of 2021 and that means less distress at foreclosure sales and REO/CWCOT second chance auctions. Lack of traditional inventory will force investors to get more inventive and figure out how to find deals within their existing markets, new markets, new sub-markets and the homes within them using data…BIG data. When leveraging all the data available today, investors need to be cognizant that these really are unprecedented times and the pandemic created unprecedented economic spikes in its wake. Data trends in nearly every sector set high & low peak records, jumping a decade worth of increases or decreases within a single quarter.  These wild movements broke data science models in every industry, including real estate. This is the reason we all hear about V, W and K shaped recoveries. In real estate, loans in forbearance spiked up then slowed dramatically to a much lower rate, loans in default have climbed from 3.8% to 6.3% (3.6 million loans) from August 2019 to August 2020 and, similarly, unemployment spiked up and then dramatically slowed. These statistics are often built into real estate market models and can deliver false positives and negatives. It is more important than ever to know which data is being applied within each model so you can make educated decisions factoring in the swings from 2020 that will continue into 2021. At Altisource, we look at dozens of public datasets to build into our models for our institutional clients and to validate the advice and recommendations for investors and agents/brokers who leverage our Equator, RentRange and Hubzu platforms. It requires crunching data sets like US Census data which includes Household Income (HHI) with home price data, our proprietary RentRange rental data, loan performance data (forbearance and delinquency) and many others into dashboards so we can compare markets with each other to see things like how many and what percentage of loans are delinquent, in forbearance or both. When you can map this data to MSAs you can then begin to layer in other data (examples would be employment data from the Bureau of Labor Statistics and Department of Labor or actively marketed rental or sale listings) to predict which markets might be more attractive for real estate investing when artificial barriers like forbearance and moratoria are modified or removed. When you layer this data over time into models with dashboards, we can look at a specific market in different ways: Household Income as a percentage of rent or home value trending over the past 5 or 10 years in that market. Comparing markets can show where high wage growth beats low wage growth and how that compares to real estate price increases versus rent increases. Some of these models can be productized like RentRange where markets or individual properties are analyzed to calculate cash flow and yield potential based on known comparable rents. Another example is at the property level on Hubzu.com where we crunch dozens of datasets to populate the investor calculator on each property on the Hubzu.com marketplace with estimates of current value, rent potential powered by RentRange, vacancy, property management cost, property taxes, HOA amounts, rehab costs and more to estimate monthly cash flow and gross/net yields. Investors can adjust these numbers in real time to see potential returns based on different auction bid amounts. Looking at a real market example, like Pensacola, can help to put things into perspective, especially when you compare that market to others across the country. Above is a “jitter plot” which looks at market data across the top 200 markets in the U.S. and shows how markets stack up against each other. The dark spots show where the Pensacola MSA ranks in each category within these top 200 markets. The first two columns show that rent (+36.5%) and home prices (+39%) have increased significantly compared to the other markets putting Pensacola in

Read More