Industry Data

Median Home Prices Unaffordable for Average Wage Earner

Home ownership consumes 32.5% of wages in fourth quarter 2019 The fourth quarter 2019 U.S. Home Affordability Report, released in mid-December by data provider ATTOM Data Solutions, shows that median home prices in the fourth quarter of 2019 were unaffordable for average wage earners in 344 of 486, or 71% of the U.S. counties analyzed in the report. The figure represents a slight improvement from previous reports. It was down from 73% in third quarter and 75% from a year earlier. The report analyzes median home prices from publicly recorded sales deed data collected by ATTOM Data Solutions and average wage data from the U.S. Bureau of Labor Statistics in 486 U.S. counties with a combined population of 235.2 million. The report determined affordability for average wage earners by calculating the amount of income needed to make monthly house payments on a median-priced home, assuming a 3% down payment and a 28% maximum “front-end” debt-to-income ratio. “Payment” included mortgage, property taxes and insurance. Average 30-year fixed interest rates from the Freddie Mac Primary Mortgage Market Survey were used to calculate the monthly house payments. The required income was compared to annualized average weekly wage data from the Bureau of Labor Statistics. “Home prices rose across the country by 9% year-over-year in the fourth quarter of 2019, and the typical home remained a financial stretch for average wage earners. However, homes were actually a bit more affordable because of declining mortgage rates combined with rising pay to overcome the continued price run-up,” said Todd Teta, chief product officer with ATTOM Data Solutions. “As long as people are earning more money and shelling out less to pay off home loans, the market should remain strong with prices continuing to rise, at least in the near term. Those are big ifs, but for now this report offers some decent findings for both home seekers and home sellers.” The largest populated counties where a median-priced home in the fourth quarter of 2019 was not affordable for average wage earners included Los Angeles County, California; Maricopa County (Phoenix), Arizona; San Diego County, California; Orange County, California (outside Los Angeles); and Miami-Dade County, Florida. The 142 counties (29% of the 486 counties analyzed) where a median-priced home in the fourth quarter of 2019 was affordable for average wage earners included Cook County (Chicago) Illinois; Harris County (Houston), Texas; Wayne County (Detroit), Michigan; Philadelphia County, Pennsylvania; and Cuyahoga County (Cleveland), Ohio. Home Price Appreciation  Outpacing Wage Growth Home price appreciation outpaced average weekly wage growth in 369 of the 486 counties analyzed in  the report (76%). The largest counties where this occurred were Los Angeles County, California;  Cook County, Illinois; Harris County (Houston),  Texas; Maricopa County, Arizona; and San Diego County, California. On the other hand, average annualized wage growth outpaced home price appreciation in 117 of the 486 counties (24%), including Orange County, California; Miami-Dade County, Florida; Kings County (Brooklyn), New York; Queens County, New York; and Santa Clara County (San Jose), California. Wages Needed to Buy a Home Among the 486 counties analyzed during the  reporting period, 311 (64%) required potential homebuyers to allocate at least 30% of their annualized weekly wages to the purchase. Counties requiring  the greatest percent included: Marin County, California (outside San Francisco; 111.2% of annualized weekly wages needed to buy a home) Kings County, New York (103.6%) Santa Cruz County, California (outside San Jose; 103%) Monterey County, California (outside San Francisco; 88%) Maui County, Hawaii (84.9%) A total of 175 counties in the report (36%) required less than 30% of potential homeowners’ annualized weekly wages to buy a home. Counties requiring the smallest percent included: Baltimore City/County, Maryland (11.2% of annualized weekly wages needed to buy a home) Bibb County (Macon), Georgia (12.4%) Rock Island County (Davenport), Illinois (14.4%) Wayne County (Detroit), Michigan (15.2%) Richmond County (Augusta), Georgia (15.2%)

Read More

U.S. Foreclosure Activity in October 2019 Climbs

ATTOM Data Solutions’ October 2019 U.S. Foreclosure Market Report shows a total of 55,197 U.S. properties with foreclosure filings—default notices, scheduled auctions or bank repossessions—in October 2019, up 13% from the previous month but down 17% from a year ago. Lenders repossessed 13,484 U.S. properties through completed foreclosures (REOs) in October 2019, up 14% from last month, hitting the highest point in total number of completed foreclosures in 2019. States that saw the greatest number in REOs in October 2019 included Florida (1,493 REOs), Texas (912 REOs), Michigan (890 REOs), California (824 REOs) and Illinois (805 REOs). Nationwide one in every 2,453 housing units had a foreclosure filing in October 2019. States with the highest foreclosure rates were New Jersey (one in every 1,316 housing units), Illinois (one in every 1,336 housing units), Maryland (one in every 1,484 housing units), South Carolina (one in every 1,534 housing units) and Florida (one in every 1,571 housing units). Lenders started the foreclosure process on 28,667 U.S. properties in October 2019, up 17% from last month but down 1% from a year ago—the first double-digit month-over-month increase since February 2018.  Counter to the national trend, 13 states, including Washington, D.C., posted month-over-month decreases in foreclosure starts in October 2019. Those states included Maryland (down 42%), Idaho (down 36%), Delaware (down 32%), Nebraska (down 26%) and Utah (

Read More

Equity-Rich Properties Represent 26.7% of All Mortgaged Properties

ATTOM Data Solutions’ third quarter 2019 U.S. Home Equity & Underwater Report shows that 14.4 million residential properties in the U.S. were considered equity rich, meaning that the combined estimated amount of loans secured by those properties was 50% or less of their estimated market value. Those equity-rich properties represented 26.7% of the 54 million mortgaged homes in the U.S. By contrast, the report shows that 3.5 million, or 6.5%, of mortgaged homes in third quarter 2019 were considered seriously underwater, with a combined estimated balance of loans secured by the property at least 25% more than the property’s estimated market value. The highest equity-rich shares were in the Northeast and West. The highest seriously underwater shares were in the South and Midwest.

Read More

Median-Priced Homes Not Affordable for Average Wage Earners in Several Markets

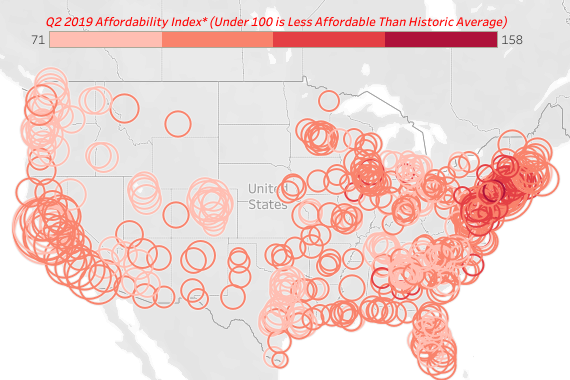
The second quarter 2019 U.S. Home Affordability Report, released June 25 by ATTOM Data Solutions, shows that median home prices in the second quarter of 2019 were not affordable for average wage earners in 353, or 74%, of 480 U.S. counties analyzed in the report.

Read More