Annual Home Price Growth Slows to Two-Year Low in November

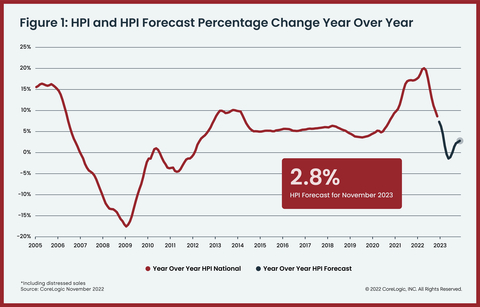
CoreLogic®, a leading global property information, analytics and data-enabled solutions provider, released the CoreLogic Home Price Index (HPI™) and HPI Forecast™ for November 2022. Year-over-year home price growth ended its 21-month streak of double-digit momentum in November, posting an 8.6% gain, the lowest rate of appreciation in exactly two years. Although 16 states bucked the national trend and saw annual double-digit increases, appreciation is decelerating in many popular housing markets across the country. Southeastern states still led the country for price growth in November but also saw some of the most pronounced cooling. Similarly, relatively more expensive Western areas also posted substantial combined declines in recent months since spring’s peak. Nationwide, the recent price deceleration pushed November home values 2.5% below the spring 2022 peak. In 2023, home values will likely move even further from that high point, as CoreLogic expects price growth to begin recording negative year-over-year readings in the second quarter. “Although home price growth has been slowing rapidly and will continue to do so in 2023, strong gains in the first half of last year suggest that total 2022 appreciation was only slightly lower than that recorded in 2021,” said Selma Hepp, executive, deputy chief economist at CoreLogic. “However, 2023 will present its own challenges, as consumers remain wary of both the housing market and the overall economic outlook.” “And while the recent decline in mortgage rates may bode well for the housing market,” Hepp continued, “potential homebuyers are grappling with the idea of buying amid possible further price declines and a continued inventory shortage. Nevertheless, with slowly improving affordability and a more optimistic economic outlook than previously believed, the housing market could show resilience in 2023.” Top Takeaways: For more information, please visit www.corelogic.com.

Read More

Updates to Conforming loan limits mean 2 million U.S. homes no longer require a jumbo loan

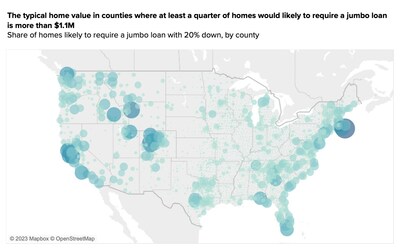
This could open up more home options for buyers shopping at higher price points and hoping to avoid the additional fees of a jumbo loan More than 2 million homes across the country no longer require a jumbo loan, according to a new analysis by Zillow Home Loans. This means customers will have additional available inventory that is covered by a more accessible financing option. The change is due to the Federal Housing Finance Agency’s (FHFA) recent increase of conforming loan limits to $1,089,300 in some high-cost markets. The news may be welcome for buyers looking to purchase a home this coming shopping season, as jumbo loans often come with additional fees and more stringent qualification standards, making them less affordable for most buyers. The FHFA increased the limits on the home price that qualifies for a conforming loan, which is the largest amount a mortgage company can lend to a borrower and still sell the loans conventionally to Fannie Mae and Freddie Mac. Compared to conforming loans, jumbo loans typically require a higher credit score — 700 is the minimum score that many lenders accept for a jumbo loan, versus the score of 620 that many require for a conforming loan. Bigger down payments are also the norm with a jumbo loan: Jumbo loans often require 20% down, although some call for even higher down payments. Some jumbo loans also will require proof of larger cash reserves than conventional loans (up to 12 months worth). For the majority of the country, the conforming loan requirement increased by $79,000 — going from $647,200 in 2022 to a baseline of $726,200 in 2023. In the most expensive parts of the country (103 counties), the conforming loan limit was raised to $1,089,300, topping the $1 million mark for the first time. These counties are largely concentrated in the nation’s most expensive metro areas, along the coasts and in the Mountain West. These updates to loan limits come within a changing housing market. While home price appreciation has slowed, home prices are still significantly higher than a year ago. Affordability challenges weighed heavily on home sales in the second half of 2022 — the number of listings that went pending in November fell by 16.5% from October and are down 38% compared to last November. “The addition of 2 million homes that now qualify for conforming loan options across the county is welcome news for home buyers entering a shopping season with fewer homes on the market,” said Nicole Bachaud, Zillow Home Loans senior economist. “Home price appreciation has slowed significantly, and this means that homes nearing jumbo loan territory will stay eligible for conforming loans longer than we have seen in the last few years.” A recent survey from Zillow Home Loans shows that prospective buyers spend nearly as much time researching their next TV purchase as they do their mortgage lender. Home buyers looking to purchase in the next year can take steps now to research and prepare for their mortgage as they get started on their home-financing journey, including: “Buyers should educate themselves about loan limits in their area and speak with qualified loan officers so they are making informed choices about their home purchase and the best loan option for their personal financial situation,” said Bachaud.  Source:  Zillow

Read More

Homes Linger on the Market as Buyers Take Their Time

The supply of homes for sale posted a record year-over-year increase this week as homes linger on the market. But some buyers are making their way back, with Redfin’s Homebuyer Demand Index showing an uptick in early-stage demand. The total number of homes for sale rose 18% from a year earlier during the four weeks ending December 25, the biggest increase since at least 2015, according to a new report from Redfin (redfin.com), the technology-powered real estate brokerage. Inventory is up even though new listings are down by double digits because homes are taking a long time to sell amid 6%-plus mortgage rates (the average 30-year rate ticked up to 6.42% this week), economic uncertainty and the typically slow holiday season. The typical home was on the market for 40 days before going under contract, more than double the record low of 18 days set in May and the slowest pace since January 2021. Just over one-quarter (28%) of homes went under contract within two weeks, the lowest share since January 2020. Some buyers are dipping their toes back in the market, as they’re able to take their time searching. Redfin’s Homebuyer Demand Index–a measure of requests for tours and other Redfin buying services–is up 14% from its October low. Still, Redfin doesn’t expect sales to tick up until well into January. “This week’s mortgage-rate pop can be chocked up to a handful of factors, but the week between Christmas and New Years is typically the slowest of the year for pending sales,” said Redfin Deputy Chief Economist Taylor Marr. “We’ll know more about the direction of rates and whether the recent uptick in early-stage demand will translate into sales when we’re settled into the new year.” Home prices fell from a year earlier in 17 of the 50 most populous U.S. metros Home-sale prices fell year over year in 17 of the 50 most populous U.S. metros during the four weeks ending December 25. Prices fell 9% year over year in San Francisco, 6.5% in San Jose, 6% in Los Angeles, 4.5% in Detroit, 4.4% in Pittsburgh, 3.7% in Sacramento, 3.6% in Oakland, CA and 2.3% in Austin. They fell 2% or less in New York, Seattle, Anaheim, CA, Phoenix, Chicago, Newark, NJ, Riverside, CA, Boston and Washington, D.C. This marks the first time Boston prices have fallen since at least 2015, as far back as this data goes. It’s the first time Washington, D.C. prices have fallen since 2016. Leading indicators of homebuying activity: Key housing market takeaways for 400+ U.S. metro areas: Unless otherwise noted, this data covers the four-week period ending December 25. Redfin’s weekly housing market data goes back through 2015. To view the full report, including charts, please visit: https://www.redfin.com/news/housing-market-update-homes-linger-on-market

Read More

As Home Buyers Continue to Seek Out Flex Spaces, Clayton Designers Answer the Call

As homeowner needs evolve, flexible floor plans provide a customizable solution without requiring renovations Clayton, a national builder of attainable housing, continues to evolve home design features as homeowner needs change. As demand for more flex spaces increases post-pandemic, Clayton is focused on providing built-in spaces within its homes that can be customized to meet the evolving needs of the household. Experience the full interactive Multichannel News Release here: https://www.multivu.com/players/English/9030355-home-buyers-seek-out-flex-spaces-clayton-designers-answer-call/ According to a recent article, home builders and designers are seeing a strong demand for flexible-living spaces, also called bonus rooms or multipurpose rooms. Rooms that serve multiple purposes appeal to buyers that want more space but can’t afford the extra square footage. As people’s lives at home evolve and continue to require flexibility, Clayton’s floor plans are adapting to include more flex spaces. A flex space is a room or area that can meet any person or family’s needs – such as a place to work from home, a dedicated spot to work out or a room to teach or play with your children. Flex spaces can include built-in desks and nooks, along with a variety of other options. Clayton offers dozens of different floor plans that incorporate flex spaces, including the Belmont and Let It Be floor plans, the Epic Collection, and Southern Charm. “The Clayton Design Team consistently looks for ways to improve the quality and style of our homes at every point in the home building journey,” said Clayton’s lead designer Megan Foster. “Our team collaborates with Clayton’s home building facilities across the country and implement top home buyer trends and designs into our newest floor plans to better serve our customers.” Consumer trends: a space to grow and adapt Clayton’s team of professional designers often lean into consumer insights research that explores how people live inside their homes. During the pandemic, the Insights team at Clayton recognized the need for more flexible spaces included in the design of available floor plans that would allow homeowners to have a space that could evolve alongside their lifestyle. For younger buyers, flex spaces offer the opportunity to adapt as their life evolves. For later generations, flex spaces on the main floor, for example, can become primary suites later in life. The Design team at Clayton aims to plan for all stages of life. While Americans have, for the most part, returned to pre-pandemic life, the desire for living spaces that can easily be transformed to suit their needs has remained. According to a recent report, many builders and architects nationally are putting in “reading nooks” and “drop zones” where they can. Three significant trends include the following: Research conducted by the Clayton Insights team echoed those trends. Between the first quarter of 2020 and the third quarter of 2021, the desire for a home that offers the ability to customize their space moved from not ranking at all to becoming one of the top 10 most important physical features of a home. Health and wellness are also top priorities for home buyers, according to research conducted by Clayton Insights. Spaces that can be used for various activities or hobbies, including an in-home gym, are top priority to prospective home buyers. In fact, these dedicated wellness spaces are part of a national trend of including “wellness design” as part of the core design of a home. By using research on demographics, lifestyle trends and working with facilities to leverage production capabilities, Clayton creates quality, on-trend products at an attainable price. View some of our most popular flex space floor plans here. About Clayton Founded in 1956, Clayton is committed to opening doors to a better life and building happyness® through homeownership. As a diverse builder committed to quality and durability, Clayton offers traditional site-built homes and off-site built housing – including modular homes, manufactured homes, CrossMod® homes, tiny homes, college dormitories, military barracks and apartments. In 2021, Clayton built 60,701 homes across the country. Clayton is a Berkshire Hathaway company. For more information, visit claytonhomes.com. CrossMod is a registered trademark of the Manufactured Housing Institute. SOURCE Clayton

Read More

Where and Why Americans Moved in 2022

Retiring Baby Boomers and Early Gen Xers Drove American Migration Patterns as Eastern States See Highest Inbound Moves United Van Lines released the company’s 46th Annual National Movers Study, which indicates Americans continued to move to lower-density areas accelerated by lifestyle preferences such as a career change, retirement and wanting to be closer to family. According to the results of the study, which tracks the company’s exclusive data for customers’ state-to-state migration patterns, Vermont saw the highest percentage of inbound migration (77%) for the second consecutive year. However, for the fifth consecutive year, the study found that more residents moved out of New Jersey than any other state, as 67% of New Jersey moves were outbound, which is down from the five-year trend of 70%. The study and its accompanying survey, which examines the motivations and influences for Americans’ interstate moves, also revealed more Baby Boomers and Gen Xers moved than any other age group last year, as those aged 55 and older accounted for more than 55% of all inbound United Van Lines moves in 2022. Additionally, the survey shows the top motivations for inbound moves include a desire to be closer to family (35%, and continues to be a primary driver post-COVID), a new job/company transfer (33%, which continues to decrease as a driver post-COVID) and retirement (20%). Oregon followed Vermont as a top inbound state for 2022 with an inbound percentage of 67%. In the Northeastern region of United States, several states – including Rhode Island (66%), Delaware(61%) and Washington, D.C. (59%) – were popular moving destinations in 2022. Southeastern states continued to see a high percentage of moves, including South Carolina (61%), North Carolina (61%) and Alabama (58%). “Key factors like retirement, wanting to be closer to family and lifestyle changes influenced by the pandemic along with current housing prices drove moving patterns in 2022,” Michael A. Stoll, economist and professor in the Department of Public Policy at the University of California, Los Angeles, said. “The United Van Lines study encompasses data that Americans are now moving from bigger to smaller cities, mostly in the South, some in the West, but even an increase of migration to the Northeast, which has not been typical. We’re also seeing younger Millennials migrating to vibrant, metropolitan economies, like Washington, D.C. and Portland, Oregon.” Additionally, Delaware, North Carolina and New Mexico (58%) joined the list of top 10 inbound states in 2022. Delaware and New Mexico cited retirement as a top motivation for moving to the states. Contrary, Wyoming (57%) and Pennsylvania (57%) joined the list of top 10 outbound states last year. Moving for a new job/company transfer is cited as the top motivation for moving out of those states. “Our United Van Lines study and survey offers year-over-year insights into where and why Americans are moving,” United Van Lines Vice President of Corporate Communications Eily Cummings said. “For the last several years, Idaho was a top destination, as Americans migrated from Northern California, Washington and even Oregon due to a similar lifestyle in the state. With an influx of new residents, housing prices and other living costs start to increase over time, and these popular destinations become hot spots for inflation. As a result, the study underscored that Americans are moving from expensive cities to lower-density, more affordable regions.” Moving InThe top inbound states of 2022 were: Of the top ten inbound states, four — Vermont, Oregon, South Dakota and New Mexico — are among the least densely populated states in America, with less than 100 people per square mile. South Dakota and New Mexico are among the top 10. Moving OutThe top outbound states for 2022 were: Balanced Several states saw nearly the same number of residents moving inbound as outbound. Missouri and Nevada are among these “balanced states.” Since 1977, United Van Lines annually tracks migration patterns on a state-by-state basis. The 2022 study is based on household moves handled by the UniGroup network (parent company of United Van Lines) within the 48 contiguous states and Washington, D.C. and ranks states based off the inbound and outbound percentages of total moves in each state. United classifies states as “high inbound” if 55 percent or more of the moves are going into a state, “high outbound” if 55 percent or more moves were coming out of a state or “balanced” if the difference between inbound and outbound is negligible. To view the entire 2022 study, an interactive map and archived press releases and photos from United, please visit United Van Lines.

Read More

The Taste Tester Investor

Co-Hosted by RCN Capital & REI INK and Sponsored by Five Brothers Asset Management, Vantage Point Title and Urban Surfaces

Read More